Cornerstones of Cost Management 2nd Edition by Don Hansen ,Maryanne Mowen
Edition 2ISBN: 978-1111824402Cornerstones of Cost Management 2nd Edition by Don Hansen ,Maryanne Mowen
Edition 2ISBN: 978-1111824402 Exercise 8
Multiple-Year Trend Reports
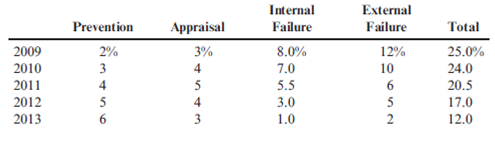
The controller of Willson Company has computed quality costs as a percentage of sales for the past five years (2009 was the first year the company implemented a quality improvement program). This information is as follows:
Required:
1. Prepare a trend graph for total quality costs. Comment on what the graph has to say about the success of the quality improvement program.
2. Prepare a graph that shows the trend for each quality cost category. What does the graph have to say about the success of the quality improvement program? Does this graph supply more insight than the total cost trend graph does?
3. Prepare a graph that compares the trend in relative quality costs. What does this graph tell you?
Explanation Verified
(1) Trend Graph for the Total Quality Co...
Cornerstones of Cost Management 2nd Edition by Don Hansen ,Maryanne Mowen
Why don’t you like this exercise?
Other Minimum 8 character and maximum 255 character
Character 255


