Cornerstones of Cost Management 2nd Edition by Don Hansen ,Maryanne Mowen
Edition 2ISBN: 978-1111824402Cornerstones of Cost Management 2nd Edition by Don Hansen ,Maryanne Mowen
Edition 2ISBN: 978-1111824402 Exercise 47
Quality Cost Performance Reporting: One-Year Trend, Long-Range Analysis
In 2013, Major Company initiated a full-scale, quality improvement program. At the end of the year, Jack Aldredge, the president, noted with some satisfaction that the defects per unit of product had dropped significantly compared to the prior year. He was also pleased that relationships with suppliers had improved and defective materials had declined. The new quality training program was also well accepted by employees. Of most interest to the president, however, was the impact of the quality improvements on profitability. To help assess the dollar impact of the quality improvements, the actual sales and the actual quality costs for 2012 and 2013 are as follows by quality category:
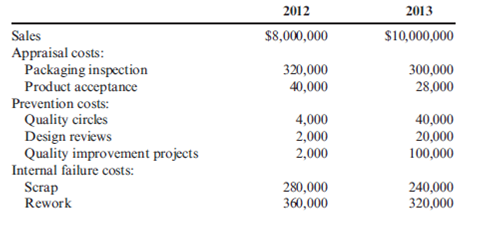
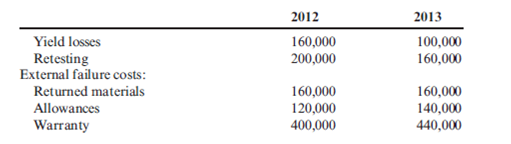
All prevention costs are fixed (by discretion). Assume all other quality costs are unit-level variable.
Required:
1. Compute the relative distribution of quality costs for each year and prepare a pie chart. Do you believe that the company is moving in the right direction in terms of the balance among the quality cost categories? Explain.
2. Prepare a one-year trend performance report for 2013 (compare the actual costs of 2013 with those of 2012, adjusted for differences in sales volume). How much have profits increased because of the quality improvements made by Major Company?
3. Estimate the additional improvement in profits if Major Company ultimately reduces its quality costs to 2.5 percent of sales revenues (assume sales of $10 million).
In 2013, Major Company initiated a full-scale, quality improvement program. At the end of the year, Jack Aldredge, the president, noted with some satisfaction that the defects per unit of product had dropped significantly compared to the prior year. He was also pleased that relationships with suppliers had improved and defective materials had declined. The new quality training program was also well accepted by employees. Of most interest to the president, however, was the impact of the quality improvements on profitability. To help assess the dollar impact of the quality improvements, the actual sales and the actual quality costs for 2012 and 2013 are as follows by quality category:
All prevention costs are fixed (by discretion). Assume all other quality costs are unit-level variable.
Required:
1. Compute the relative distribution of quality costs for each year and prepare a pie chart. Do you believe that the company is moving in the right direction in terms of the balance among the quality cost categories? Explain.
2. Prepare a one-year trend performance report for 2013 (compare the actual costs of 2013 with those of 2012, adjusted for differences in sales volume). How much have profits increased because of the quality improvements made by Major Company?
3. Estimate the additional improvement in profits if Major Company ultimately reduces its quality costs to 2.5 percent of sales revenues (assume sales of $10 million).
Explanation Verified
Profit comparison for 2012 and 2013
• D...
Cornerstones of Cost Management 2nd Edition by Don Hansen ,Maryanne Mowen
Why don’t you like this exercise?
Other Minimum 8 character and maximum 255 character
Character 255


