Cornerstones of Cost Management 2nd Edition by Don Hansen ,Maryanne Mowen
Edition 2ISBN: 978-1111824402Cornerstones of Cost Management 2nd Edition by Don Hansen ,Maryanne Mowen
Edition 2ISBN: 978-1111824402 Exercise 55
Trend Analysis, Quality Costs
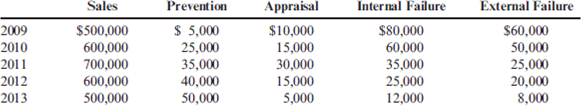
In 2009, Milton Thayne, president of Carbondale Electronics, received a report indicating that quality costs were 31 percent of sales. Faced with increasing pressures from imported goods, Milton resolved to take measures to improve the overall quality of the company's products. After hiring a consultant in 2010, the company began an aggressive program of total quality control. At the end of 2013, Milton requested an analysis of the progress the company had made in reducing and controlling quality costs. The Accounting Department assembled the following data:
Required:
1. Compute the quality costs as a percentage of sales by category and in total for each year.
2. Prepare a multiple-year trend graph for quality costs, both by total costs and by category. Using the graph, assess the progress made in reducing and controlling quality costs. Does the graph provide evidence that quality has improved? Explain.
3. Using the 2009 quality cost relationships (assume all costs are variable), calculate the quality costs that would have prevailed in 2012. By how much did profits increase in 2012 because of the quality improvement program? Repeat for 2013.
Explanation Verified
1.QUALITY COSTS
• Quality cost report i...
Cornerstones of Cost Management 2nd Edition by Don Hansen ,Maryanne Mowen
Why don’t you like this exercise?
Other Minimum 8 character and maximum 255 character
Character 255


