Cornerstones of Cost Management 2nd Edition by Don Hansen ,Maryanne Mowen
Edition 2ISBN: 978-1111824402Cornerstones of Cost Management 2nd Edition by Don Hansen ,Maryanne Mowen
Edition 2ISBN: 978-1111824402 Exercise 59
Case on Quality Cost Performance Reports
Iona Company, a large printing company, is in its fourth year of a five-year, quality improvement program. The program began in 2009 with an internal study that revealed the quality costs being incurred. In that year, a five-year plan was developed to lower quality costs to 10 percent of sales by the end of 2013. Sales and quality costs for each year are as follows:
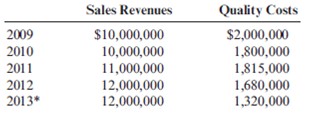
* Budgeted figures.
Quality costs by category are expressed as a percentage of sales as follows:
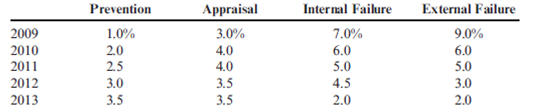
The detail of the 2013 budget for quality costs is also provided.
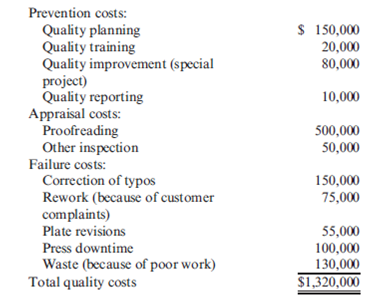
All prevention costs are fixed; all other quality costs are variable.
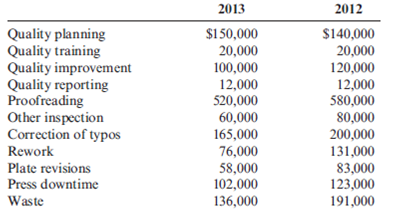
During 2013, the company had $12 million in sales. Actual quality costs for 2012 and 2013 are as follows:
Required:
1. Prepare an interim quality cost performance report for 2013 that compares actual quality costs with budgeted quality costs. Comment on the firm's ability to achieve its quality goals for the year.
2. Prepare a one-period quality performance report for 2013 that compares the actual quality costs of 2012 with the actual costs of 2013. How much did profits change because of improved quality?
3. Prepare a graph that shows the trend in total quality costs as a percentage of sales since the inception of the quality improvement program.
4. Prepare a graph that shows the trend for all four quality cost categories for 2009 through 2013. How does this graph help management know that the reduction in total quality costs is attributable to quality improvements?
5. Assume that the company is preparing a second five-year plan to reduce quality costs to 2.5 percent of sales. Prepare a long-range quality cost performance report assuming sales of $15 million at the end of five years. Assume that the final planned relative distribution of quality costs is as follows: proofreading, 50 percent; other inspection, 13 percent; quality training, 30 percent; and quality reporting, 7 percent.
Iona Company, a large printing company, is in its fourth year of a five-year, quality improvement program. The program began in 2009 with an internal study that revealed the quality costs being incurred. In that year, a five-year plan was developed to lower quality costs to 10 percent of sales by the end of 2013. Sales and quality costs for each year are as follows:
* Budgeted figures.
Quality costs by category are expressed as a percentage of sales as follows:
The detail of the 2013 budget for quality costs is also provided.
All prevention costs are fixed; all other quality costs are variable.
During 2013, the company had $12 million in sales. Actual quality costs for 2012 and 2013 are as follows:
Required:
1. Prepare an interim quality cost performance report for 2013 that compares actual quality costs with budgeted quality costs. Comment on the firm's ability to achieve its quality goals for the year.
2. Prepare a one-period quality performance report for 2013 that compares the actual quality costs of 2012 with the actual costs of 2013. How much did profits change because of improved quality?
3. Prepare a graph that shows the trend in total quality costs as a percentage of sales since the inception of the quality improvement program.
4. Prepare a graph that shows the trend for all four quality cost categories for 2009 through 2013. How does this graph help management know that the reduction in total quality costs is attributable to quality improvements?
5. Assume that the company is preparing a second five-year plan to reduce quality costs to 2.5 percent of sales. Prepare a long-range quality cost performance report assuming sales of $15 million at the end of five years. Assume that the final planned relative distribution of quality costs is as follows: proofreading, 50 percent; other inspection, 13 percent; quality training, 30 percent; and quality reporting, 7 percent.
Explanation Verified
Interium Quality Cost Performance Report...
Cornerstones of Cost Management 2nd Edition by Don Hansen ,Maryanne Mowen
Why don’t you like this exercise?
Other Minimum 8 character and maximum 255 character
Character 255


