
Macroeconomics 13th Edition by William Baumol ,Alan Blinder
Edition 13ISBN: 978-1305280601Macroeconomics 13th Edition by William Baumol ,Alan Blinder
Edition 13ISBN: 978-1305280601 Exercise 6
Add the aggregate supply and demand schedules below to the example in Test Yourself Question 1 of Chapter 9 (page₁92) to see how inflation affects the multiplier.
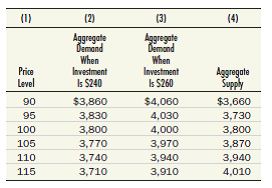
Draw these schedules on a piece of graph paper.
a. Notice that the difference between columns (2) and (3), which show the aggregate demand schedule at two different levels of investment, is always $200. Discuss how this constant gap of $200 relates to your answer in the previous chapter.
b. Find the equilibrium GDP and the equilibrium price level both before and after the increase in investment. What is the value of the multiplier Compare that to the multiplier you found in Test Yourself Question 2 of Chapter 9.
Reference Question 1 of Chapter 9
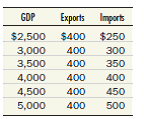
Suppose exports and imports of a country are given by the following:
Reference Question 2 of Chapter 9
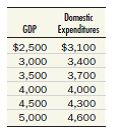
If domestic expenditure (the sum of C + I + G in the economy described in Test Yourself Question 1) is as shown in the following table, construct a 45° line diagram and locate the equilibrium level of GDP.
Draw these schedules on a piece of graph paper.
a. Notice that the difference between columns (2) and (3), which show the aggregate demand schedule at two different levels of investment, is always $200. Discuss how this constant gap of $200 relates to your answer in the previous chapter.
b. Find the equilibrium GDP and the equilibrium price level both before and after the increase in investment. What is the value of the multiplier Compare that to the multiplier you found in Test Yourself Question 2 of Chapter 9.
Reference Question 1 of Chapter 9
Suppose exports and imports of a country are given by the following:
Reference Question 2 of Chapter 9
If domestic expenditure (the sum of C + I + G in the economy described in Test Yourself Question 1) is as shown in the following table, construct a 45° line diagram and locate the equilibrium level of GDP.
Explanation Verified
a. Comparison of change in aggregate dem...
Macroeconomics 13th Edition by William Baumol ,Alan Blinder
Why don’t you like this exercise?
Other Minimum 8 character and maximum 255 character
Character 255


