
Introduction to Management Science 12th Edition by Bernard Taylor
Edition 12ISBN: 978-0133778847Introduction to Management Science 12th Edition by Bernard Taylor
Edition 12ISBN: 978-0133778847 Exercise 6
For the Bigelow Manufacturing example in this chapter, re-create the simulation for the improved maintenance program shown in Table and Exhibit 1 using Crystal Ball. For the improved program assume that the repair time is normally distributed with a mean of 1.70 days and a standard deviation of 0.6 day. Assume that the time between breakdowns is defined by the triangular distribution for the improved maintenance program used in the example. Using Crystal Ball, determine the average annual number of breakdowns, average annual repair time, and average annual repair cost. Compare this improved maintenance system with the current one (Problem), and indicate whether it should be adopted given the cost of improving the system (i.e., $20,000).
Problem
For the Bigelow Manufacturing example in this chapter, re-create the simulation shown in Table and Exhibit 2 using Crystal Ball. Assume that the repair time is normally distributed with a mean of 2.15 days and a standard deviation of 0.8 day. Assume that the time between breakdowns is defined by the triangular distribution used in the example. Using Crystal Ball, determine the average annual number of breakdowns, average annual repair time, and average annual repair cost.
Table
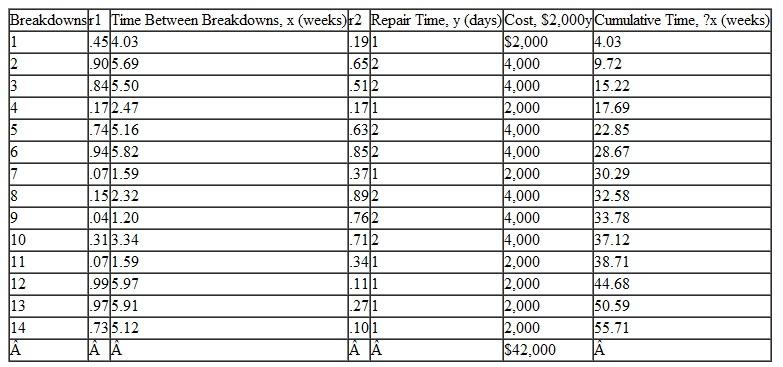 Exhibit 1
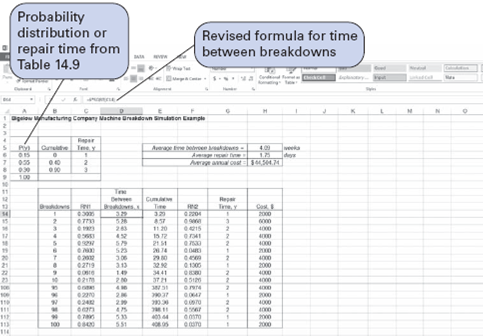
Exhibit 2
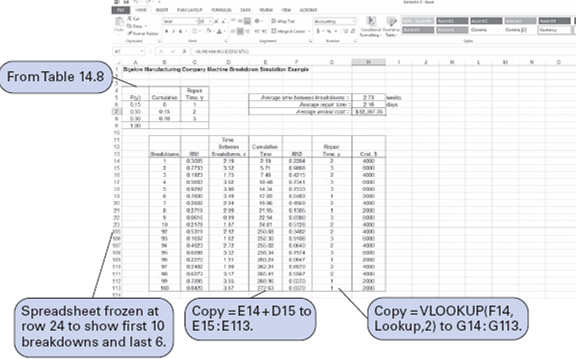
Exhibit 1 shows the Excel spreadsheet simulation for the modified breakdown system with the new maintenance program, which was simulated manually in Table. The two differences in this simulation model are the cumulative probability distribution formulas for the time between breakdowns and the reduced repair time distributions from Table in cells A6:C8.
The average annual cost for this model, shown in cell H8, is $44,504.74. This annual cost is only slightly higher than the $42,000 obtained from the manual simulation in Table. Thus, as before, the decision should be to implement the new maintenance system.
Exhibit 1
Problem
For the Bigelow Manufacturing example in this chapter, re-create the simulation shown in Table and Exhibit 2 using Crystal Ball. Assume that the repair time is normally distributed with a mean of 2.15 days and a standard deviation of 0.8 day. Assume that the time between breakdowns is defined by the triangular distribution used in the example. Using Crystal Ball, determine the average annual number of breakdowns, average annual repair time, and average annual repair cost.
Table
Exhibit 1 Exhibit 2
Exhibit 1 shows the Excel spreadsheet simulation for the modified breakdown system with the new maintenance program, which was simulated manually in Table. The two differences in this simulation model are the cumulative probability distribution formulas for the time between breakdowns and the reduced repair time distributions from Table in cells A6:C8.
The average annual cost for this model, shown in cell H8, is $44,504.74. This annual cost is only slightly higher than the $42,000 obtained from the manual simulation in Table. Thus, as before, the decision should be to implement the new maintenance system.
Exhibit 1
Explanation

This question doesn’t have an expert verified answer yet, let Examlex AI Copilot help.
Introduction to Management Science 12th Edition by Bernard Taylor
Why don’t you like this exercise?
Other Minimum 8 character and maximum 255 character
Character 255


