
Introduction to Management Science 12th Edition by Bernard Taylor
Edition 12ISBN: 978-0133778847Introduction to Management Science 12th Edition by Bernard Taylor
Edition 12ISBN: 978-0133778847 Exercise 29
In Chapter, Figure shows a simplified project network for building a house, as follows:
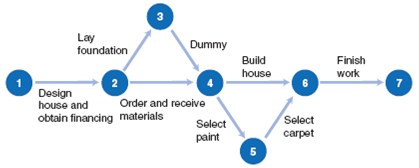
There are four paths through this network:
Path A: 1-2-3-4-6-7
Path B: 1-2-3-4-5-6-7
Path C: 1-2-4-6-7
Path D: 1-2-4-5-6-7
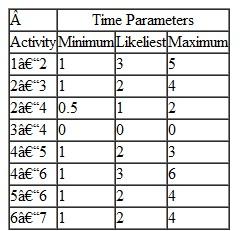
The time parameters (in weeks) defining a triangular probability distribution for each activity are provided as follows:
 a. Using Crystal Ball, simulate each path in the network and identify the longest path (i.e., the critical path).
b. Observing the simulation run frequency chart for path A, determine the probability that this path will exceed the critical path time. What does this tell you about the simulation results for a project network versus an analytical result
Figure Expanded network for building a house, showing concurrent activities
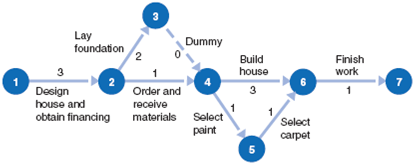
There are four paths through this network:
Path A: 1-2-3-4-6-7
Path B: 1-2-3-4-5-6-7
Path C: 1-2-4-6-7
Path D: 1-2-4-5-6-7
The time parameters (in weeks) defining a triangular probability distribution for each activity are provided as follows:
a. Using Crystal Ball, simulate each path in the network and identify the longest path (i.e., the critical path).b. Observing the simulation run frequency chart for path A, determine the probability that this path will exceed the critical path time. What does this tell you about the simulation results for a project network versus an analytical result
Figure Expanded network for building a house, showing concurrent activities
Explanation Verified
The project network for building a house...
Introduction to Management Science 12th Edition by Bernard Taylor
Why don’t you like this exercise?
Other Minimum 8 character and maximum 255 character
Character 255


