
Introduction to Management Science 12th Edition by Bernard Taylor
Edition 12ISBN: 978-0133778847Introduction to Management Science 12th Edition by Bernard Taylor
Edition 12ISBN: 978-0133778847 Exercise 9
Graph the demand data in Problem. Can you identify any trends, cycles, or seasonal patterns
Problem
The Fastgro Fertilizer Company distributes fertilizer to various lawn and garden shops. The company must base its quarterly production schedule on a forecast of how many tons of fertilizer will be demanded from it. The company has gathered the following data for the past 3 years from its sales records:
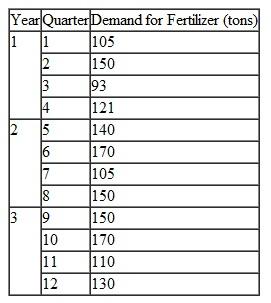 a. Compute a three-quarter moving average forecast for quarters 4 through 13 and compute the forecast error for each quarter.
b. Compute a five-quarter moving average forecast for quarters 6 through 13 and compute the forecast error for each quarter.
c. Compute a weighted three-quarter moving average forecast, using weights of.50,.33, and.17 for the most recent, next most recent, and most distant data, respectively, and compute the forecast error for each quarter.
d. Compare the forecasts developed in (a), (b), and (c), using cumulative error. Which forecast appears to be most accurate Do any of them exhibit any bias
Problem
The Fastgro Fertilizer Company distributes fertilizer to various lawn and garden shops. The company must base its quarterly production schedule on a forecast of how many tons of fertilizer will be demanded from it. The company has gathered the following data for the past 3 years from its sales records:
a. Compute a three-quarter moving average forecast for quarters 4 through 13 and compute the forecast error for each quarter.b. Compute a five-quarter moving average forecast for quarters 6 through 13 and compute the forecast error for each quarter.
c. Compute a weighted three-quarter moving average forecast, using weights of.50,.33, and.17 for the most recent, next most recent, and most distant data, respectively, and compute the forecast error for each quarter.
d. Compare the forecasts developed in (a), (b), and (c), using cumulative error. Which forecast appears to be most accurate Do any of them exhibit any bias
Explanation Verified
![]()
![]()
![]()
![]()
![]()
![]()
![]()
![]()
![]()
![]() ...
...
Introduction to Management Science 12th Edition by Bernard Taylor
Why don’t you like this exercise?
Other Minimum 8 character and maximum 255 character
Character 255


