
Introduction to Management Science 12th Edition by Bernard Taylor
Edition 12ISBN: 978-0133778847Introduction to Management Science 12th Edition by Bernard Taylor
Edition 12ISBN: 978-0133778847 Exercise 56
Develop an adjusted exponential smoothing forecast model ( =.40 and =.40) for the data in Problem to forecast seat occupancy and compare its accuracy with the seasonally adjusted model developed in (a).
Problem
Arrow Air is a regional East Coast airline that has collected data for the percentage of available seats occupied on its flights for four quarters-(1) January-March, (2) April-June, (3) July- September, and (4) October-December-for the past 5 years. Arrow Air also has collected data for the average percentage fare discount for each of these quarters, as follows:
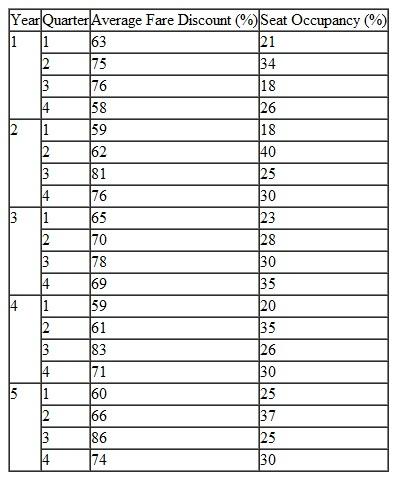 a. Develop a seasonally adjusted forecast model for seat occupancy. Forecast seat occupancy for year 6 by using a linear trend line forecast estimate for seat occupancy in year 6.
b. Develop linear regression models relating seat occupancy to discount fares in order to forecast seat occupancy for each quarter in year 6. Assume a fare discount of 20% for quarter 1, 36% for quarter 2, 25% for quarter 3, and 30% for quarter 4.
c. Compare the forecasts developed in (a) and (b) and indicate which one appears to be the best.
Problem
Arrow Air is a regional East Coast airline that has collected data for the percentage of available seats occupied on its flights for four quarters-(1) January-March, (2) April-June, (3) July- September, and (4) October-December-for the past 5 years. Arrow Air also has collected data for the average percentage fare discount for each of these quarters, as follows:
a. Develop a seasonally adjusted forecast model for seat occupancy. Forecast seat occupancy for year 6 by using a linear trend line forecast estimate for seat occupancy in year 6.b. Develop linear regression models relating seat occupancy to discount fares in order to forecast seat occupancy for each quarter in year 6. Assume a fare discount of 20% for quarter 1, 36% for quarter 2, 25% for quarter 3, and 30% for quarter 4.
c. Compare the forecasts developed in (a) and (b) and indicate which one appears to be the best.
Explanation Verified
Exponential smoothing forecast technique...
Introduction to Management Science 12th Edition by Bernard Taylor
Why don’t you like this exercise?
Other Minimum 8 character and maximum 255 character
Character 255


