Managerial Economics 13th Edition by James McGuigan,Charles Moyer,Frederick Harris
Edition 13ISBN: 978-1285420929Managerial Economics 13th Edition by James McGuigan,Charles Moyer,Frederick Harris
Edition 13ISBN: 978-1285420929 Exercise 2
Define Q as the level of output produced and sold, and suppose that a firm's total revenue (TR) and total cost (TC) functions can be represented in tabular form as shown here.
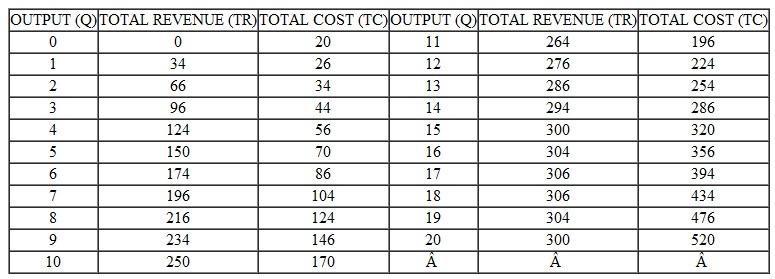
a. Compute the marginal revenue and average revenue functions.
b. Compute the marginal cost and average cost functions.
c. On a single graph, plot the total revenue, total cost, marginal revenue, and marginal cost functions.
d. Determine the output level in the graph that maximizes profits (Profit = Total revenue = Total cost) by finding the point where marginal revenue equals marginal cost.
e. Check your result in part (d) by finding the output level in the tables developed in parts (a) and (b) that likewise satisfies the condition that marginal revenue equals marginal cost.
Explanation Verified
Managerial Economics 13th Edition by James McGuigan,Charles Moyer,Frederick Harris
Why don’t you like this exercise?
Other Minimum 8 character and maximum 255 character
Character 255


