
Managerial Economics 13th Edition by James McGuigan,Charles Moyer,Frederick Harris
Edition 13ISBN: 978-1285420929Managerial Economics 13th Edition by James McGuigan,Charles Moyer,Frederick Harris
Edition 13ISBN: 978-1285420929 Exercise 14
Multigenerational Effects of Ozone Depletion and Greenhouse Gases 12
The long-term effects of ozone depletion from hydrochlorofluorocarbon (HCFC) emissions and of CO₂ and other greenhouse gases from the burning of fossil fuels are controversial. Environmental scientists insist that the release of HCFCs opened a gaping hole in the ozone shield that provides protection from the sun's ultraviolet (UV) rays. More recently, some scientists have argued that the increasing concentration of greenhouse gases has raised global temperatures. What is less controversial is that these environmental events have massive consequences for human health and wealth. Increasing incidence of skin cancers, melting polar icecaps, and rising sea levels imply tangible losses of catastrophic proportions-perhaps many billions of dollars annually. Some of these losses are immediate, but others are perhaps 100 years off.
Benefit-cost analysis normally considers projects no more than 20 to 30 years long and employs discount rates of 2 to 8 percent. How should one discount such an uncertain and distant future as is involved in ozone depletion and greenhouse gases Assuming a constant discount rate equal to the rate of return on long-term government bonds (5.43 percent), the discount factor that should be applied to find the present value of projected benefits or losses avoided in year 100 would be (1/1.057 100 ) = 0.003913 or $3,913,780 present value per billion dollars of future losses avoided in year 100. Notice what happens, however, if uncertainty about the appropriate discount rate varies from 2 to 8 percent. The discount factor at 100 years would then vary from (1/1.02 100 ) = 0.13803 or $138,032,967 per billion dollars for 2 percent, to as little as (1/1.08 100 ) = 0.000454, or $454,595 per billion dollars for 8 percent.
The possibility of lower discount rates implies that more than $138 million dollars should be spent today to avoid the projected $1 billion in delayed damage 100 years from now! Of course, the higher 8 percent rate implies spending less than one-half a million to avoid the $100 billion future loss. This range of present value estimates from $138 million to $454,595 is beyond what any analyst can work with in doing sensitivity analysis. What should a benefit-cost analyst conclude And what should businesses whose cash flows depend on "fun in the sun" recreation like golf courses and theme parks and beachside hotels or physical assets built near sea level like the New York and Shanghai business districts conclude about the justifiable capital expenditure to slow down or reverse global warming
One insight is that it is not the 5 percent average discount rate between 2 and 8 percent that matters in such circumstances, just as the average depth of a pool does not determine the hazard to someone who cannot swim. Instead, the lowest applicable discount rate largely determines the present value of very distant cash flows because higher-discount-rate scenarios like 7 and 8 percent inevitably sum to essentially zero at 100 years.
Martin Weitzman has calculated what discount rate is implied by assuming the discount rate begins at 4 percent and then follows a random path with equiprobable higher and lower rates and a standard deviation of 3 percent. The results led him to recommend a sliding-scale discount rate of 2 percent for 25- to 75-year and 1 percent for 76- to 300-year cash flows. The fact that lower discount rates have such dramatically nonsymmetrical effects on present value when very distant benefits are involved means that the present value of reducing CO₂ emissions and other greenhouse gases may be much higher than previously thought.
As decision makers worldwide consider the options for reducing greenhouse gases (CO₂ , methane, nitrous oxide, etc.), one glaring fact surfaces quickly. The U.S. Energy Information Administration estimates that 41 percent of all the CO₂ emissions we generate in the United States come from electricity generation, and 83 percent of that comes from burning coal (see Figure). So, 34 percent (0.41 × 0.83) of all U.S. CO₂ emissions comes from coal-fired power plants. Not surprisingly, much interest in preventing global warming has therefore centered on alternative sources of electrical energy generation. The popular inequality RE
FIGURE Greenhouse Gas Emissions in the United States
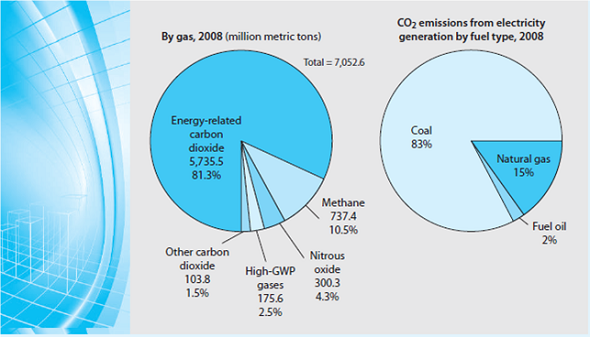
What exactly are the alternative sources of electrical energy Wind power, solar power, biomass, hydro, biofuel, geothermal, and ocean tidal power all contain some attractive common features for the United States. They are renewable resources in abundant local supply with low carbon footprints. At present, only 5 percent of electrical generation comes from all these alternative energy sources rather than coal (83 percent), natural gas (15 percent), or negligible fuel oil (again see Figure 17.3). Natural gas is now much cheaper today than coal per British thermal unit (BTU), but its carbon footprint (though 80 percent cleaner than coal) is still quite substantial. Rather than spending almost $1 billion a day in net wealth transfer for foreign crude oil, Americans now perceive that natural gas is their most plentiful energy resource. Indeed, at present rates of consumption, the United States has more proven reserves of coal (100 years) and natural gas (110 years' worth) than Saudi Arabia has proven reserves of oil (85 years).

But 1 ton of coal generates a megawatt of electricity plus 1 ton of CO₂ byproduct. The marginal cost for delivered coal has varied from $45 to $82 per ton in 2007-2012, and the electricity is worth from $0.06/kWh in Washington state to $0.12/kWh in New York state. Taking the 2013 cost of coal ($88) and the weighted average value of electricity across the United States ($0.11), the electrical generation industry pays $80 per ton for coal on the spot market and produces a $110 megawatt of electricity.
The problem is that when one includes the market cost of a ton of CO₂ byproduct, using the 2013 price of the CO₂ emission trading contract in the European Union (EU) of $10, 13 a typical public utility in the United States must recover all its capital cost from the remaining tiny $12 operating profit ($110 - $88 - $10 = $12) per megawatt hour. Even a giant 500-megawatt U.S. power plant would therefore project (under a capand- trade carbon emissions trading regime) net cash flow of only $6,000 per hour for perhaps 20 hours a day or $120,000 per day to recover capital equipment costs and earn a profit. That sums to $42 million per year, sufficient at a 5% CoC to generate only $840 million present value of the net cash flow against the $900 million net investment of a 500-megawatt coal-fired power plant plus smokestack scrubbers, even if the cash flows last 50 years.
The way forward is natural gas (NG) production, which has exploded in the United States, resulting in an 84 percent reduction in its equilibrium price, now half the cost of coal per BTU.
Which is more likely to be adopted a) an optimal carbon tax of 7% higher electricity cost and 2% higher gasoline costs or b) a cap and trade carbon emission trading system Why
The long-term effects of ozone depletion from hydrochlorofluorocarbon (HCFC) emissions and of CO₂ and other greenhouse gases from the burning of fossil fuels are controversial. Environmental scientists insist that the release of HCFCs opened a gaping hole in the ozone shield that provides protection from the sun's ultraviolet (UV) rays. More recently, some scientists have argued that the increasing concentration of greenhouse gases has raised global temperatures. What is less controversial is that these environmental events have massive consequences for human health and wealth. Increasing incidence of skin cancers, melting polar icecaps, and rising sea levels imply tangible losses of catastrophic proportions-perhaps many billions of dollars annually. Some of these losses are immediate, but others are perhaps 100 years off.
Benefit-cost analysis normally considers projects no more than 20 to 30 years long and employs discount rates of 2 to 8 percent. How should one discount such an uncertain and distant future as is involved in ozone depletion and greenhouse gases Assuming a constant discount rate equal to the rate of return on long-term government bonds (5.43 percent), the discount factor that should be applied to find the present value of projected benefits or losses avoided in year 100 would be (1/1.057 100 ) = 0.003913 or $3,913,780 present value per billion dollars of future losses avoided in year 100. Notice what happens, however, if uncertainty about the appropriate discount rate varies from 2 to 8 percent. The discount factor at 100 years would then vary from (1/1.02 100 ) = 0.13803 or $138,032,967 per billion dollars for 2 percent, to as little as (1/1.08 100 ) = 0.000454, or $454,595 per billion dollars for 8 percent.
The possibility of lower discount rates implies that more than $138 million dollars should be spent today to avoid the projected $1 billion in delayed damage 100 years from now! Of course, the higher 8 percent rate implies spending less than one-half a million to avoid the $100 billion future loss. This range of present value estimates from $138 million to $454,595 is beyond what any analyst can work with in doing sensitivity analysis. What should a benefit-cost analyst conclude And what should businesses whose cash flows depend on "fun in the sun" recreation like golf courses and theme parks and beachside hotels or physical assets built near sea level like the New York and Shanghai business districts conclude about the justifiable capital expenditure to slow down or reverse global warming
One insight is that it is not the 5 percent average discount rate between 2 and 8 percent that matters in such circumstances, just as the average depth of a pool does not determine the hazard to someone who cannot swim. Instead, the lowest applicable discount rate largely determines the present value of very distant cash flows because higher-discount-rate scenarios like 7 and 8 percent inevitably sum to essentially zero at 100 years.
Martin Weitzman has calculated what discount rate is implied by assuming the discount rate begins at 4 percent and then follows a random path with equiprobable higher and lower rates and a standard deviation of 3 percent. The results led him to recommend a sliding-scale discount rate of 2 percent for 25- to 75-year and 1 percent for 76- to 300-year cash flows. The fact that lower discount rates have such dramatically nonsymmetrical effects on present value when very distant benefits are involved means that the present value of reducing CO₂ emissions and other greenhouse gases may be much higher than previously thought.
As decision makers worldwide consider the options for reducing greenhouse gases (CO₂ , methane, nitrous oxide, etc.), one glaring fact surfaces quickly. The U.S. Energy Information Administration estimates that 41 percent of all the CO₂ emissions we generate in the United States come from electricity generation, and 83 percent of that comes from burning coal (see Figure). So, 34 percent (0.41 × 0.83) of all U.S. CO₂ emissions comes from coal-fired power plants. Not surprisingly, much interest in preventing global warming has therefore centered on alternative sources of electrical energy generation. The popular inequality RE
FIGURE Greenhouse Gas Emissions in the United States
What exactly are the alternative sources of electrical energy Wind power, solar power, biomass, hydro, biofuel, geothermal, and ocean tidal power all contain some attractive common features for the United States. They are renewable resources in abundant local supply with low carbon footprints. At present, only 5 percent of electrical generation comes from all these alternative energy sources rather than coal (83 percent), natural gas (15 percent), or negligible fuel oil (again see Figure 17.3). Natural gas is now much cheaper today than coal per British thermal unit (BTU), but its carbon footprint (though 80 percent cleaner than coal) is still quite substantial. Rather than spending almost $1 billion a day in net wealth transfer for foreign crude oil, Americans now perceive that natural gas is their most plentiful energy resource. Indeed, at present rates of consumption, the United States has more proven reserves of coal (100 years) and natural gas (110 years' worth) than Saudi Arabia has proven reserves of oil (85 years).
But 1 ton of coal generates a megawatt of electricity plus 1 ton of CO₂ byproduct. The marginal cost for delivered coal has varied from $45 to $82 per ton in 2007-2012, and the electricity is worth from $0.06/kWh in Washington state to $0.12/kWh in New York state. Taking the 2013 cost of coal ($88) and the weighted average value of electricity across the United States ($0.11), the electrical generation industry pays $80 per ton for coal on the spot market and produces a $110 megawatt of electricity.
The problem is that when one includes the market cost of a ton of CO₂ byproduct, using the 2013 price of the CO₂ emission trading contract in the European Union (EU) of $10, 13 a typical public utility in the United States must recover all its capital cost from the remaining tiny $12 operating profit ($110 - $88 - $10 = $12) per megawatt hour. Even a giant 500-megawatt U.S. power plant would therefore project (under a capand- trade carbon emissions trading regime) net cash flow of only $6,000 per hour for perhaps 20 hours a day or $120,000 per day to recover capital equipment costs and earn a profit. That sums to $42 million per year, sufficient at a 5% CoC to generate only $840 million present value of the net cash flow against the $900 million net investment of a 500-megawatt coal-fired power plant plus smokestack scrubbers, even if the cash flows last 50 years.
The way forward is natural gas (NG) production, which has exploded in the United States, resulting in an 84 percent reduction in its equilibrium price, now half the cost of coal per BTU.
Which is more likely to be adopted a) an optimal carbon tax of 7% higher electricity cost and 2% higher gasoline costs or b) a cap and trade carbon emission trading system Why
Explanation

This question doesn’t have an expert verified answer yet, let Examlex AI Copilot help.
Managerial Economics 13th Edition by James McGuigan,Charles Moyer,Frederick Harris
Why don’t you like this exercise?
Other Minimum 8 character and maximum 255 character
Character 255


