
Managerial Economics 12th Edition by Christopher Thomas,Charles Maurice
Edition 12ISBN: 978-0078021909Managerial Economics 12th Edition by Christopher Thomas,Charles Maurice
Edition 12ISBN: 978-0078021909 Exercise 5
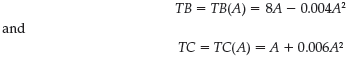
In Figure 3.1, the total benefit and total cost curves are represented by the following mathematical functions:
a. Find the marginal benefit function. Verify that points c, b, and d in Figure 3.2 lie on the marginal benefit curve.
b. Find the marginal cost function. Verify that points c ', b, and d ' in Figure 3.2 lie on the marginal cost curve.
c. Derive the net benefit function. Verify the slopes of net benefit at points M, c ", and d " in Figure 3.3.
d. Find the optimal level of activity and the maximum value of net benefit. Does your answer match Figure 3.3?
Figure 3.1 for Reference:
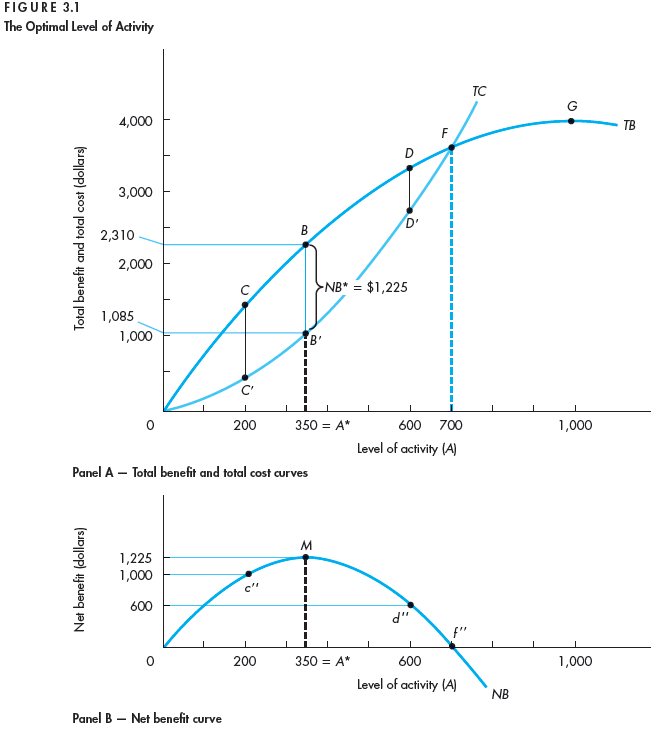
Figure 3.2 for Reference:
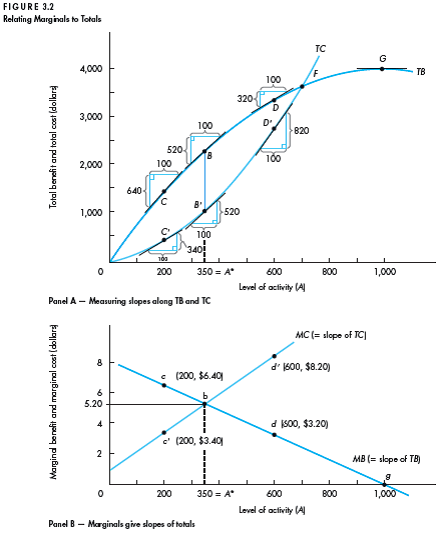
Figure 3.3 for Reference:
a. Find the marginal benefit function. Verify that points c, b, and d in Figure 3.2 lie on the marginal benefit curve.
b. Find the marginal cost function. Verify that points c ', b, and d ' in Figure 3.2 lie on the marginal cost curve.
c. Derive the net benefit function. Verify the slopes of net benefit at points M, c ", and d " in Figure 3.3.
d. Find the optimal level of activity and the maximum value of net benefit. Does your answer match Figure 3.3?
Figure 3.1 for Reference:
Figure 3.2 for Reference:
Figure 3.3 for Reference:
Explanation Verified
a. Marginal benefit is the derivative of...
Managerial Economics 12th Edition by Christopher Thomas,Charles Maurice
Why don’t you like this exercise?
Other Minimum 8 character and maximum 255 character
Character 255


