Microeconomic Theory 11th Edition by Walter Nicholson,Christopher Snyder
Edition 11ISBN: 978-1111525538Microeconomic Theory 11th Edition by Walter Nicholson,Christopher Snyder
Edition 11ISBN: 978-1111525538 Exercise 2
Suppose the production function for widgets is given by
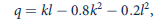
where q represents the annual quantity of widgets produced, k represents annual capital input, and l represents annual labor input.
a. Suppose k = 10; graph the total and average productivity of labor curves. At what level of labor input does this average productivity reach a maximum? How many widgets are produced at that point?
b. Again assuming that k = 10, graph the MP l curve. At what level of labor input does MP l = 0?
c. Suppose capital inputs were increased to k = 20. How would your answers to parts (a) and (b) change?
d. Does the widget production function exhibit constant, increasing, or decreasing returns to scale?
Explanation Verified
a.
The production function shows all the...
Microeconomic Theory 11th Edition by Walter Nicholson,Christopher Snyder
Why don’t you like this exercise?
Other Minimum 8 character and maximum 255 character
Character 255


