Macroeconomics 19th Edition by Campbell McConnell , Stanley Brue,Sean Flynn
Edition 19ISBN: 978-0077337728Macroeconomics 19th Edition by Campbell McConnell , Stanley Brue,Sean Flynn
Edition 19ISBN: 978-0077337728 Exercise 2
Indicate how each of the following might affect the data shown in the table and graph in FigurE2 of this appendix:
Explanation Verified
The graph below represents the inverse relationship between ticket prices and game attendance at Gigantic State University.
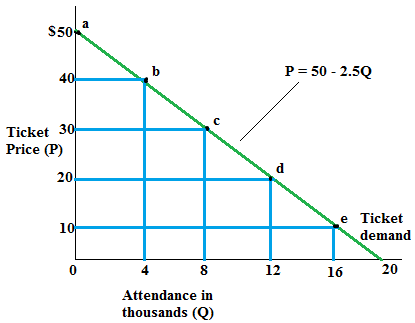 Any change of factors other than price will shift the line.
a. The change of schedule makes the game more attractive, which induces more demands at every price level. The line will shift outward.
b. The NBA team attracts some of the audience, which decreases the sales of tickets at GSU at any price level. Thus, the line will shift inward.
c. The television contracts provide an alternative way to watch the game, and less people will watch the game at the stadium at any price level. Thus, the line will shift inward.
Any change of factors other than price will shift the line.a. The change of schedule makes the game more attractive, which induces more demands at every price level. The line will shift outward.
b. The NBA team attracts some of the audience, which decreases the sales of tickets at GSU at any price level. Thus, the line will shift inward.
c. The television contracts provide an alternative way to watch the game, and less people will watch the game at the stadium at any price level. Thus, the line will shift inward.
Macroeconomics 19th Edition by Campbell McConnell , Stanley Brue,Sean Flynn
Why don’t you like this exercise?
Other Minimum 8 character and maximum 255 character
Character 255


