
Business Forecasting 9th Edition by John Hanke, Dean Wichern
Edition 9ISBN: 978-0132301206Business Forecasting 9th Edition by John Hanke, Dean Wichern
Edition 9ISBN: 978-0132301206 Exercise 4
MURPHY BROTHERS FURNITURE
In 1958, the Murphy brothers established a furniture store in downtown Dallas. Over the years, they were quite successful and extended their retail coverage throughout the West and Midwest. By 1996, their chain of furniture stores had become well established in 36 states.
Julie Murphy, the daughter of one of the founders, had recently joined the firm. Her father and uncle were sophisticated in many ways but not in the area of quantitative skills. In particular, they both felt that they could not accurately forecast the future sales of Murphy Brothers using modern computer techniques. For this reason, they appealed to Julie for help as part of her new job.
Julie first considered using Murphy sales dollars as her variable but found that several years of history were missing. She asked her father, Glen, about this, and he told her that at the time he "didn't think it was that important." Julie explained the importance of past data to Glen, and he indicated that he would save future data.
Julie decided that Murphy sales were probably closely related to national sales figures and decided to search for an appropriate variable in one of the many federal publications. After looking through a recent copy of the Survey of Current Business, she found the history on monthly sales for all retail stores in the United States and decided to use this variable as a substitute for her variable of interest, Murphy Brothers sales dollars. She reasoned that, if she could establish accurate forecasts for national sales, she could relate these forecasts to Murphy's own sales and come up with the forecasts she wanted.
Table 3-8 shows the data that Julie collected, and Figure 3-22 shows a data plot provided by Julie's computer program. Julie began her analysis by using the computer to develop a plot of the autocorrelation coefficients.
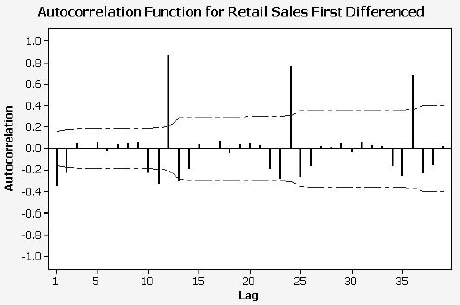
After examining the autocorrelation function produced in Figure 3-23, it was obvious to Julie that her data contain a trend. The early autocorrelation coefficients are very large, and they drop toward zero very slowly with time. To make the series stationary so that various forecasting methods could be considered, Julie decided to first difference her data to see if the trend could be removed. The autocorrelation function for the first differenced data is shown in Figure 3-24.
TABLE 3-8 Monthly Sales ($ billions) for All Retail Stores, 1983-1995
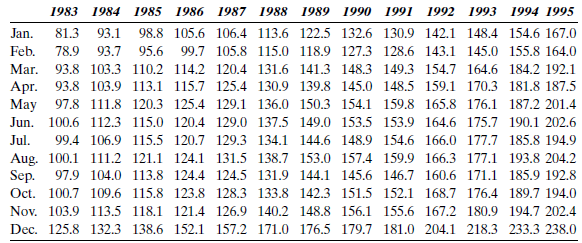
Source: Based on Survey of Current Business , various years.
FIGURE 3-22 Time Series Graph of Monthly Sales for All U.S. Retail Stores, 1983-1995
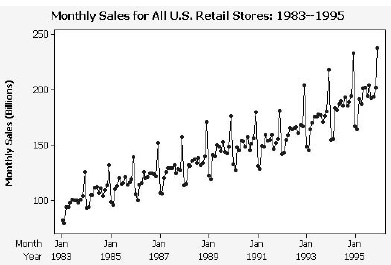
FIGURE 3-23 Autocorrelation Function for Monthly Sales for All U.S. Retail Stores
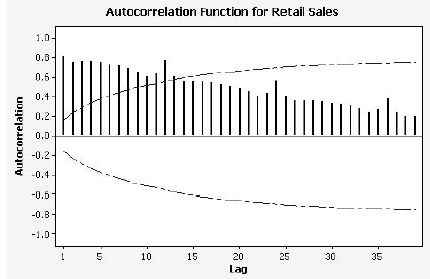
FIGURE 3-24 Autocorrelation Function for Monthly Sales for All U.S. Retail Stores First Differenced
How will Julie know which technique works best?
In 1958, the Murphy brothers established a furniture store in downtown Dallas. Over the years, they were quite successful and extended their retail coverage throughout the West and Midwest. By 1996, their chain of furniture stores had become well established in 36 states.
Julie Murphy, the daughter of one of the founders, had recently joined the firm. Her father and uncle were sophisticated in many ways but not in the area of quantitative skills. In particular, they both felt that they could not accurately forecast the future sales of Murphy Brothers using modern computer techniques. For this reason, they appealed to Julie for help as part of her new job.
Julie first considered using Murphy sales dollars as her variable but found that several years of history were missing. She asked her father, Glen, about this, and he told her that at the time he "didn't think it was that important." Julie explained the importance of past data to Glen, and he indicated that he would save future data.
Julie decided that Murphy sales were probably closely related to national sales figures and decided to search for an appropriate variable in one of the many federal publications. After looking through a recent copy of the Survey of Current Business, she found the history on monthly sales for all retail stores in the United States and decided to use this variable as a substitute for her variable of interest, Murphy Brothers sales dollars. She reasoned that, if she could establish accurate forecasts for national sales, she could relate these forecasts to Murphy's own sales and come up with the forecasts she wanted.
Table 3-8 shows the data that Julie collected, and Figure 3-22 shows a data plot provided by Julie's computer program. Julie began her analysis by using the computer to develop a plot of the autocorrelation coefficients.
After examining the autocorrelation function produced in Figure 3-23, it was obvious to Julie that her data contain a trend. The early autocorrelation coefficients are very large, and they drop toward zero very slowly with time. To make the series stationary so that various forecasting methods could be considered, Julie decided to first difference her data to see if the trend could be removed. The autocorrelation function for the first differenced data is shown in Figure 3-24.
TABLE 3-8 Monthly Sales ($ billions) for All Retail Stores, 1983-1995
Source: Based on Survey of Current Business , various years.
FIGURE 3-22 Time Series Graph of Monthly Sales for All U.S. Retail Stores, 1983-1995
FIGURE 3-23 Autocorrelation Function for Monthly Sales for All U.S. Retail Stores
FIGURE 3-24 Autocorrelation Function for Monthly Sales for All U.S. Retail Stores First Differenced
How will Julie know which technique works best?
Explanation Verified
As a result of comparing an error measur...
Business Forecasting 9th Edition by John Hanke, Dean Wichern
Why don’t you like this exercise?
Other Minimum 8 character and maximum 255 character
Character 255


