
Business Forecasting 9th Edition by John Hanke, Dean Wichern
Edition 9ISBN: 978-0132301206Business Forecasting 9th Edition by John Hanke, Dean Wichern
Edition 9ISBN: 978-0132301206 Exercise 4
BUTCHER PRODUCTS, INC.
Gene Butcher is owner and president of Butcher Products, Inc., a small company that makes fiberglass ducting for electrical cable installations. Gene has been studying the number of duct units manufactured per day over the past two and a half years and is concerned about the wide variability in this figure. To forecast production output, costs, and revenues properly, Gene needs to establish a relationship between output and some other variable.
Based on his experience with the company, Gene is unable to come up with any reason for the variability in output until he begins thinking about weather conditions. His reasoning is that the outside temperature may have something to do with the productivity of his workforce and the daily output achieved.
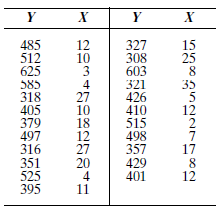
He randomly selects several days from his records and records the number of ducting units produced for each of these days. He then goes to the local weather bureau and, for each of the selected days, records the high temperature for the day. He is then ready to run a correlation study between these two figures when he realizes that output would probably be related to deviation from an ideal temperature rather than to the temperature itself. That is, he thinks that a day that is either too hot or too cold would have a negative effect on production when compared with a day that has an ideal temperature. He decides to convert his temperature readings to deviations from 65 degrees Fahrenheit, a temperature he understands is ideal in terms of generating high worker output. His data appear as follows; Y represents the number of units produced, while X represents the absolute difference (negative signs eliminated) between the day's high temperature and 65 degrees:
Gene performs a simple linear regression analysis using his company's computer and the Minitab software program.
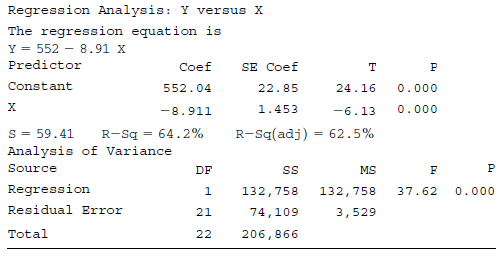
Gene is pleased to see the results of his regression analysis, as presented in Table 6-14. The t values corresponding to the estimated intercept and slope coefficients are large (in absolute value), and their p -values are very small. Both coefficients (552 and ?8.9) in the sample regression equation are clearly significant.
Turning to r 2 , Gene is somewhat disappointed to find that this value, although satisfactory, is not as high as he had hoped (64.2%). However, he decides that it is high enough to begin thinking about ways to increase daily production levels.
TABLE 6-14 Regression Analysis Output for Butcher Products, Inc.
Do you think Gene has developed an effective forecasting tool?
Gene Butcher is owner and president of Butcher Products, Inc., a small company that makes fiberglass ducting for electrical cable installations. Gene has been studying the number of duct units manufactured per day over the past two and a half years and is concerned about the wide variability in this figure. To forecast production output, costs, and revenues properly, Gene needs to establish a relationship between output and some other variable.
Based on his experience with the company, Gene is unable to come up with any reason for the variability in output until he begins thinking about weather conditions. His reasoning is that the outside temperature may have something to do with the productivity of his workforce and the daily output achieved.
He randomly selects several days from his records and records the number of ducting units produced for each of these days. He then goes to the local weather bureau and, for each of the selected days, records the high temperature for the day. He is then ready to run a correlation study between these two figures when he realizes that output would probably be related to deviation from an ideal temperature rather than to the temperature itself. That is, he thinks that a day that is either too hot or too cold would have a negative effect on production when compared with a day that has an ideal temperature. He decides to convert his temperature readings to deviations from 65 degrees Fahrenheit, a temperature he understands is ideal in terms of generating high worker output. His data appear as follows; Y represents the number of units produced, while X represents the absolute difference (negative signs eliminated) between the day's high temperature and 65 degrees:
Gene performs a simple linear regression analysis using his company's computer and the Minitab software program.
Gene is pleased to see the results of his regression analysis, as presented in Table 6-14. The t values corresponding to the estimated intercept and slope coefficients are large (in absolute value), and their p -values are very small. Both coefficients (552 and ?8.9) in the sample regression equation are clearly significant.
Turning to r 2 , Gene is somewhat disappointed to find that this value, although satisfactory, is not as high as he had hoped (64.2%). However, he decides that it is high enough to begin thinking about ways to increase daily production levels.
TABLE 6-14 Regression Analysis Output for Butcher Products, Inc.
Do you think Gene has developed an effective forecasting tool?
Explanation Verified
Explanation:
Gene probably obtained an ...
Business Forecasting 9th Edition by John Hanke, Dean Wichern
Why don’t you like this exercise?
Other Minimum 8 character and maximum 255 character
Character 255


