
Business Forecasting 9th Edition by John Hanke, Dean Wichern
Edition 9ISBN: 978-0132301206Business Forecasting 9th Edition by John Hanke, Dean Wichern
Edition 9ISBN: 978-0132301206 Exercise 3
RESTAURANT SALES
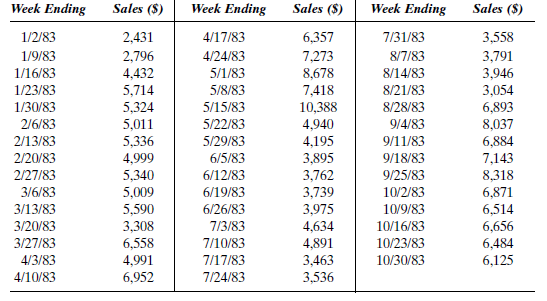
This case refers to the sales data and situation for the restaurant discussed in Case 8-3. Jim Price has now completed a course in forecasting and is anxious to apply the Box-Jenkins methodology to the restaurant sales data. These data, shown in Table 9-17A, begin with the week ending Sunday, January 4, 1981, and continue through the week ending Sunday, December 26, 1982. Table 9-17B contains new data for the week ending January 2, 1983, through the week ending October 30, 1983.
TABLE 9-17A Restaurant Sales: Old Data
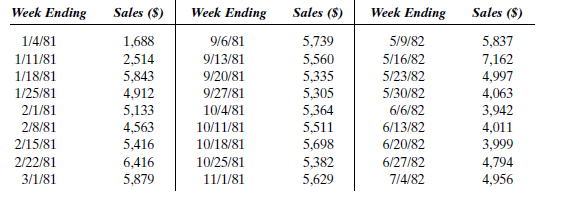
TABLE 9-17A ( Continued )
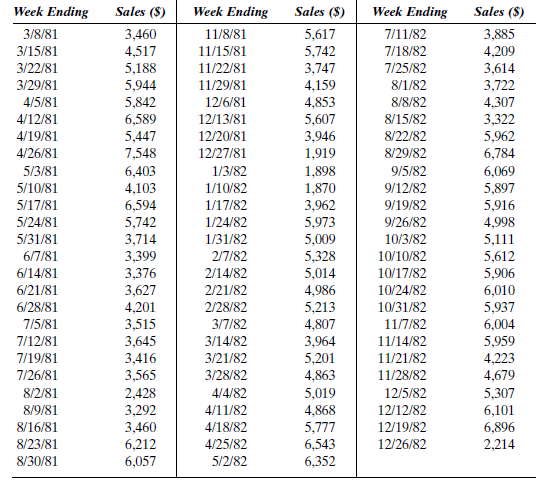
TABLE 9-17B Restaurant Sales: New Data
How do these forecasts compare with actual sales?
This case refers to the sales data and situation for the restaurant discussed in Case 8-3. Jim Price has now completed a course in forecasting and is anxious to apply the Box-Jenkins methodology to the restaurant sales data. These data, shown in Table 9-17A, begin with the week ending Sunday, January 4, 1981, and continue through the week ending Sunday, December 26, 1982. Table 9-17B contains new data for the week ending January 2, 1983, through the week ending October 30, 1983.
TABLE 9-17A Restaurant Sales: Old Data
TABLE 9-17A ( Continued )
TABLE 9-17B Restaurant Sales: New Data
How do these forecasts compare with actual sales?
Explanation Verified
Compare the forecast value with actual s...
Business Forecasting 9th Edition by John Hanke, Dean Wichern
Why don’t you like this exercise?
Other Minimum 8 character and maximum 255 character
Character 255


