Environmental Science 14th Edition by Tyler Miller ,Scott Spoolman
Edition 14ISBN: 978-1111988937Environmental Science 14th Edition by Tyler Miller ,Scott Spoolman
Edition 14ISBN: 978-1111988937 Exercise 2
Consider the graph below that shows loss of calcium from the experimental cutover site of the Hubbard Brook Experimental Forest compared with that of the control site. Note that this figure is very similar to Figure 2-4, which compares loss of nitrates from the two sites. After studying this graph answer the questions below.
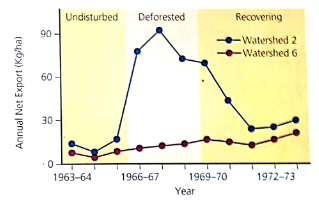
Does this graph support the hypothesis that cutting the trees from a forested area causes the area to lose nutrients more quickly than leaving the trees in place Explain.
Does this graph support the hypothesis that cutting the trees from a forested area causes the area to lose nutrients more quickly than leaving the trees in place Explain.
Explanation Verified
The change in calcium concentration for ...
Environmental Science 14th Edition by Tyler Miller ,Scott Spoolman
Why don’t you like this exercise?
Other Minimum 8 character and maximum 255 character
Character 255


