Environmental Science 14th Edition by Tyler Miller ,Scott Spoolman
Edition 14ISBN: 978-1111988937Environmental Science 14th Edition by Tyler Miller ,Scott Spoolman
Edition 14ISBN: 978-1111988937 Exercise 17
This graph shows data collected by scientists who were investigating biodiversity on islands as it relates to island size and distance from the nearest mainland. One of the hypotheses developed by these scientists was that larger islands tend to have higher species densities.
The graph shows measurements taken for two variables: the area on an island within which measurements were taken, and the population density of a certain species of lizard found in each area. Note that the areas studied varied from 100 square meters (m 2 ) (1,076 square feet) to 300 m 2 (3.228 square feet), as shown on the x-axis. Population densities measured by the scientists varied from 0.1 to 0.4 individuals per m 2 (y-axis). Study the data and answer the following questions.
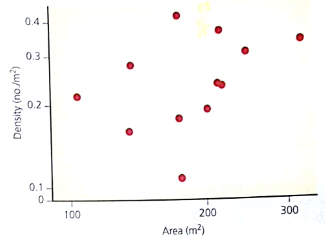
How many measurements above 0.2 individuals per m 2 were made How many of these measurements were made in areas smaller than 200 m 2 How many were made in areas larger than m 2
The graph shows measurements taken for two variables: the area on an island within which measurements were taken, and the population density of a certain species of lizard found in each area. Note that the areas studied varied from 100 square meters (m 2 ) (1,076 square feet) to 300 m 2 (3.228 square feet), as shown on the x-axis. Population densities measured by the scientists varied from 0.1 to 0.4 individuals per m 2 (y-axis). Study the data and answer the following questions.
How many measurements above 0.2 individuals per m 2 were made How many of these measurements were made in areas smaller than 200 m 2 How many were made in areas larger than m 2
Explanation Verified
Eight measurements were taken above the ...
Environmental Science 14th Edition by Tyler Miller ,Scott Spoolman
Why don’t you like this exercise?
Other Minimum 8 character and maximum 255 character
Character 255


