
Environmental Science 14th Edition by Tyler Miller ,Scott Spoolman
Edition 14ISBN: 978-1111988937Environmental Science 14th Edition by Tyler Miller ,Scott Spoolman
Edition 14ISBN: 978-1111988937 Exercise 3
The graph below shows changes in the size of an emperor penguin population in terms of breeding pairs on the island of Terre Adelie in the Antarctic. Use the graph to answer the questions below.
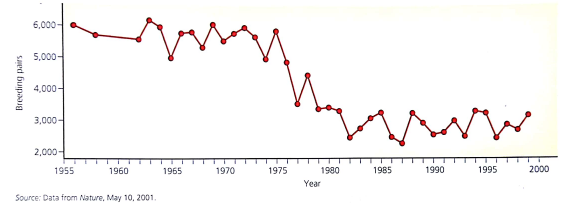
What was the percentage decline in the penguin population from 1975 to 2000
What was the percentage decline in the penguin population from 1975 to 2000
Explanation Verified
According to the data analyses...
Environmental Science 14th Edition by Tyler Miller ,Scott Spoolman
Why don’t you like this exercise?
Other Minimum 8 character and maximum 255 character
Character 255


