
Cost Management 6th Edition by Edward Blocher,David Stout ,Paul Juras,Gary Cokins
Edition 6ISBN: 978-0078025532Cost Management 6th Edition by Edward Blocher,David Stout ,Paul Juras,Gary Cokins
Edition 6ISBN: 978-0078025532 Exercise 3
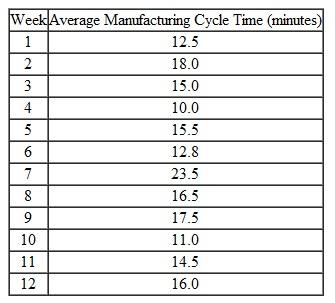
Control Charts Refer to the background information in Exercise 17-60 for the Destin Company. One of the quality improvements management instituted recently was the use of statistical control charts. Over the most recent 12-week period, you have obtained the following average cycle-time data regarding the valve-production process:
 Required
1. Use Excel to prepare a control chart from the weekly, sequential observations given above. Management has determined that the target performance level for cycle time is 14.0 minutes, and that the upper and lower control limits should be set, respectively, at 16.0 and 12.0 minutes.
2. What is the mean and what is the standard deviation of the 12 manufacturing cycle-time observations
3. What conclusions can you draw about the process, based on the cycle-time data contained in your spreadsheet
4. What is the primary difference between the control chart you produced and what is called a statistical control chart
Required 1. Use Excel to prepare a control chart from the weekly, sequential observations given above. Management has determined that the target performance level for cycle time is 14.0 minutes, and that the upper and lower control limits should be set, respectively, at 16.0 and 12.0 minutes.
2. What is the mean and what is the standard deviation of the 12 manufacturing cycle-time observations
3. What conclusions can you draw about the process, based on the cycle-time data contained in your spreadsheet
4. What is the primary difference between the control chart you produced and what is called a statistical control chart
Explanation Verified
1.Control Chart-Manufacturing Cycle Time...
Cost Management 6th Edition by Edward Blocher,David Stout ,Paul Juras,Gary Cokins
Why don’t you like this exercise?
Other Minimum 8 character and maximum 255 character
Character 255


