Fundamentals of Cost Accounting 2nd Edition by William Lanen, Carolyn Wells, Michael Maher
Edition 2ISBN: 978-0077274993Fundamentals of Cost Accounting 2nd Edition by William Lanen, Carolyn Wells, Michael Maher
Edition 2ISBN: 978-0077274993 Exercise 24
Interpretation of Regression Results: Multiple Choice
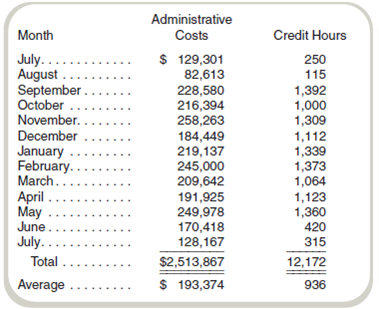
The Business School at Eastern College is collecting data as a first step in the preparation of next year's budget. One cost that is being looked at closely is administrative staff as a function of student credit hours. Data on administrative costs and credit hours for the most recent 13 months follow:
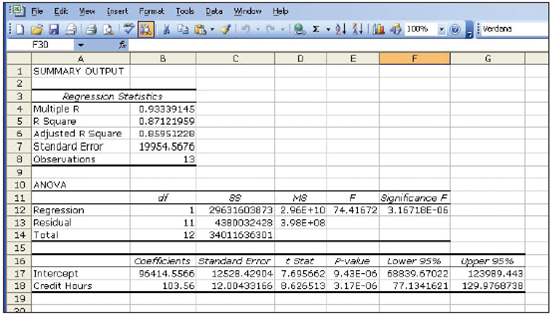
The controller's office has analyzed the data and given you the results from the regression analysis:
Required
a. In the standard regression equation y = a + bx , the letter b is best described as the
(1) Independent variable.
(2) Dependent variable.
(3) Constant coefficient.
(4) Variable cost coefficient.
(5) Correlation coefficient.
b. In the standard regression equation y = a + bx , the letter y is best described as the
(1) Independent variable.
(2) Dependent variable.
(3) Constant coefficient.
(4) Variable cost coefficient.
(5) Correlation coefficient.
c. In the standard regression equation y = a + bx , the letter x is best described as the
(1) Independent variable.
(2) Dependent variable.
(3) Constant coefficient.
(4) Variable cost coefficient.
(5) Correlation coefficient.
d. If the controller uses the high-low method to estimate costs, the cost equation for administrative costs is
(1) Cost = $67,313 + $133 × Credit hours.
(2) Cost = $59,424 + $202 × Credit hours.
(3) Cost = $206.50 × Credit hours.
(4) Cost = $193,374.
(5) Some other equation.
e. Based on the results of the controller's regression analysis, the estimate of administrative costs in a month with 1,000 credit hours would be
(1) $198,808.
(2) $201,000.
(3) $199,975.
(4) $96,409.
(5) Some other amount.
f. The correlation coefficient (rounded) for the regression equation for administrative costs is
(1) 0.933.
(2) 0.871.
(3) 0.859.
(4) .
.
(5) Some other amount.
g. The percent of the total variance (rounded) that can be explained by the regression is
(1) 93.3.
(2) 87.1.
(3) 85.9.
(4) 96.6.
(5) Some other amount.
The Business School at Eastern College is collecting data as a first step in the preparation of next year's budget. One cost that is being looked at closely is administrative staff as a function of student credit hours. Data on administrative costs and credit hours for the most recent 13 months follow:
The controller's office has analyzed the data and given you the results from the regression analysis:
Required
a. In the standard regression equation y = a + bx , the letter b is best described as the
(1) Independent variable.
(2) Dependent variable.
(3) Constant coefficient.
(4) Variable cost coefficient.
(5) Correlation coefficient.
b. In the standard regression equation y = a + bx , the letter y is best described as the
(1) Independent variable.
(2) Dependent variable.
(3) Constant coefficient.
(4) Variable cost coefficient.
(5) Correlation coefficient.
c. In the standard regression equation y = a + bx , the letter x is best described as the
(1) Independent variable.
(2) Dependent variable.
(3) Constant coefficient.
(4) Variable cost coefficient.
(5) Correlation coefficient.
d. If the controller uses the high-low method to estimate costs, the cost equation for administrative costs is
(1) Cost = $67,313 + $133 × Credit hours.
(2) Cost = $59,424 + $202 × Credit hours.
(3) Cost = $206.50 × Credit hours.
(4) Cost = $193,374.
(5) Some other equation.
e. Based on the results of the controller's regression analysis, the estimate of administrative costs in a month with 1,000 credit hours would be
(1) $198,808.
(2) $201,000.
(3) $199,975.
(4) $96,409.
(5) Some other amount.
f. The correlation coefficient (rounded) for the regression equation for administrative costs is
(1) 0.933.
(2) 0.871.
(3) 0.859.
(4)
.(5) Some other amount.
g. The percent of the total variance (rounded) that can be explained by the regression is
(1) 93.3.
(2) 87.1.
(3) 85.9.
(4) 96.6.
(5) Some other amount.
Explanation Verified
Interpretation of Regression Results of ...
Fundamentals of Cost Accounting 2nd Edition by William Lanen, Carolyn Wells, Michael Maher
Why don’t you like this exercise?
Other Minimum 8 character and maximum 255 character
Character 255


