
Economics 19th Edition by Stanley Brue, Cambell McConnell, Campbell McConnell, Sean Masaki Flynn, Sean Flynn
Edition 19ISBN: 978-0076601783Economics 19th Edition by Stanley Brue, Cambell McConnell, Campbell McConnell, Sean Masaki Flynn, Sean Flynn
Edition 19ISBN: 978-0076601783 Exercise 2
Indicate how each of the following might affect the data shown in the table and graph in Figure 2 of this appendix:
a. GSU's athletic director schedules higher-quality opponents.
b. An NBA teamin the city where GSU plays.
c. GSU contracts to have all its home games televised.
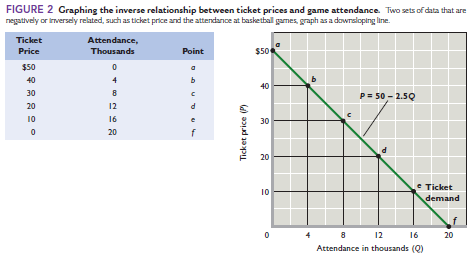
Reference table and graph in Figure 2
a. GSU's athletic director schedules higher-quality opponents.
b. An NBA teamin the city where GSU plays.
c. GSU contracts to have all its home games televised.
Reference table and graph in Figure 2
Explanation Verified
According to the law of demand, there is an inverse relationship between the price and the demand for a good, keeping other factors constant. In other words, a rise in price leads to a fall in the demand and a fall in the price leads to a rise in the demand.
A decrease or an increase in the price causes the downward movement (increase in quantity) or upward movement (decrease in quantity) along the same demand curve. A change in the factors other than price cause shift of the demand curve.
The figure 2 of the appendix depicts the inverse relationship between the ticket price and attendance for the basketball games at GSU through data and graph.
a.
When the director of GSU schedules higher-quality opponents, the number of attendance for the basketball games at GSU will increase. Therefore, the number of attendance at each price level will increase. As a result of an increase in the attendance at each price level, the demand curve will shift to the right.
b.
The NBA teams are national level basketball teams and people tend to see their game over other basketball games. When the NBA teams located in the same city where GSU plays, the number of attendance will decrease at each price level. Thus, the demand curve for attendance at GSU will shift to the left.
c.
When GSU contracts to televise the games, the number of attendance at each price level will decrease. This is because people will prefer to watch the game at their home with comfort instead of sitting in the stadium. As a result, the demand curve for the attendance at GSU will shift to the left.
Economics 19th Edition by Stanley Brue, Cambell McConnell, Campbell McConnell, Sean Masaki Flynn, Sean Flynn
Why don’t you like this exercise?
Other Minimum 8 character and maximum 255 character
Character 255


