
Macroeconomics 12th Edition by Michael Parkin
Edition 12ISBN: 978-0133872279Macroeconomics 12th Edition by Michael Parkin
Edition 12ISBN: 978-0133872279 Exercise 2
Explain what scatter diagrams show and why we use them.
Explanation Verified
A scatter diagram is a kind of a graph that plots the value of one variable against the value of another variable. It shows a number of different values of each variable. It basically, tells whether a relationship exists between two variables, on the x-axis and the y-axis, and describes the relationship between them. If a relationship exists between the two variables, and the points in the scatter diagram indicate association, then apparently there is a high correlation that exists between two variables.
On the basis of the information given in the table below, a scatter plot has been made as follows:
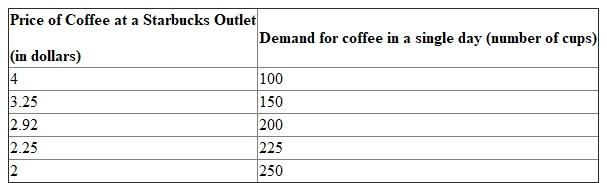
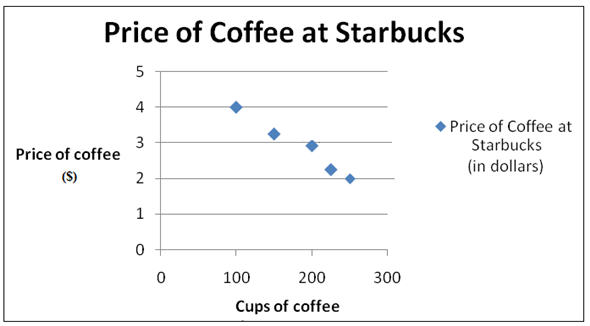 The above scatter diagram has 'cups of coffee' on the x-axis, and the price of coffee at Starbucks on the y-axis. The two axes meet at the point of origin. When the price of the coffee is $4, then 100 cups are demanded in a day. When the price falls to $3.25, the number of coffee cups demanded in a day increases to 150 cups. Further, when price falls to $2, the demand rises to 250 cups. As the price of the coffee is rising, the demand for the coffee is falling. Thus, it shows a negative relation between price and demand.
In economics, we use scatter diagrams to find the relationship, if any, exists between two variables, and the kind of relationship that exists between the two variables. In the illustration, we found that there is a negative relationship between price and demand, which agrees with the law of demand.
On the basis of the information given in the table below, a scatter plot has been made as follows:
The above scatter diagram has 'cups of coffee' on the x-axis, and the price of coffee at Starbucks on the y-axis. The two axes meet at the point of origin. When the price of the coffee is $4, then 100 cups are demanded in a day. When the price falls to $3.25, the number of coffee cups demanded in a day increases to 150 cups. Further, when price falls to $2, the demand rises to 250 cups. As the price of the coffee is rising, the demand for the coffee is falling. Thus, it shows a negative relation between price and demand.In economics, we use scatter diagrams to find the relationship, if any, exists between two variables, and the kind of relationship that exists between the two variables. In the illustration, we found that there is a negative relationship between price and demand, which agrees with the law of demand.
Macroeconomics 12th Edition by Michael Parkin
Why don’t you like this exercise?
Other Minimum 8 character and maximum 255 character
Character 255


