
Fundamentals of Financial Accounting 4th Edition by Fred Phillips,Robert Libby,Patricia Libby
Edition 4ISBN: 978-0078025372Fundamentals of Financial Accounting 4th Edition by Fred Phillips,Robert Libby,Patricia Libby
Edition 4ISBN: 978-0078025372 Exercise 41
Computing, Charting, and Interpreting Time-Series and Cross-Sectional Analyses
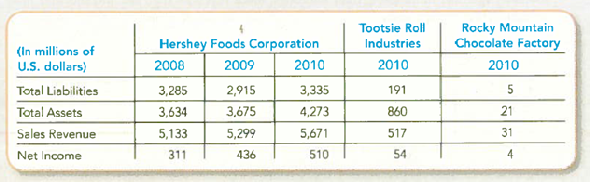
Assume that Candy Industry Magazine has contracted you to write an article discussing the financial status of Hershey Foods Corporation over the last few years. The editor suggests that your article should also compare Hershey's recent financial performance to competitors like Tootsie Roll Industries and Rocky Mountain Chocolate Factory. You gather the following information from the 2010 10-Ks of the three companies.
Required:
Enter the above information into a spreadsheet and perform the following analyses:
1. Time-series analysis : Demonstrate the changes in Hershey's size over the three years by charting its total liabilities, total assets, sales revenues, and net income.
2. Cross-sectional analysis : Demonstrate the size of Hershey relative to Tootsie Roll and Rocky Mountain Chocolate Factory, by charting the three companies' total liabilities, total assets, sales revenues, and net income for 2010.
3. Ratio analysis : Compare the performance of Hershey relative to Tootsie Roll and Rocky Mountain Chocolate Factory, by computing the debt-to-assets and net profit margin ratios for 2010.
Explanation Verified
Two common benchmarks for evaluation of ...
Fundamentals of Financial Accounting 4th Edition by Fred Phillips,Robert Libby,Patricia Libby
Why don’t you like this exercise?
Other Minimum 8 character and maximum 255 character
Character 255


