
Macroeconomics 12th Edition by Rudiger Dornbusch ,Stanley Fischer,Richard Startz
Edition 12ISBN: 978-1259070969Macroeconomics 12th Edition by Rudiger Dornbusch ,Stanley Fischer,Richard Startz
Edition 12ISBN: 978-1259070969 Exercise 2
Section 10-2 analyses the consumption function, and What More Do We Know 10-1 shows that the consumption function holds in practice for the United States. In this exercise you will derive a consumption function for Australia.
a. Go to the Penn World Tables ( http://pwt.econ.upenn.edu ). Click on "Penn World Table" and then "Data Download." Download Australian data for:
• Real Gross Domestic Income (RGDPL adjusted for Terms of Trade changes).
• Consumption Share of Real GDP per capita (RGDPL) and Real GDP per capita (Constant Prices: Chain series). ( Note: To get total consumption per capita, you will need to multiply consumption share of real GDP by real GDP.)
b. Create a scatterplot that has Real Gross Domestic Income per capita on the X axis and Total Consumption per capita on the Y axis. What is the relationship between consumption and income in Australia Visually, on average by how much would an increase of AU$10 billion in income affect consumption Using your answer, compute the marginal propensity to consume for Australia.
*c. If you have taken a statistics class, use EXCEL or a statistical program in order to run the following regression:
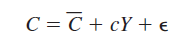
What is the implied slope What does it mean Is it statistically significant
a. Go to the Penn World Tables ( http://pwt.econ.upenn.edu ). Click on "Penn World Table" and then "Data Download." Download Australian data for:
• Real Gross Domestic Income (RGDPL adjusted for Terms of Trade changes).
• Consumption Share of Real GDP per capita (RGDPL) and Real GDP per capita (Constant Prices: Chain series). ( Note: To get total consumption per capita, you will need to multiply consumption share of real GDP by real GDP.)
b. Create a scatterplot that has Real Gross Domestic Income per capita on the X axis and Total Consumption per capita on the Y axis. What is the relationship between consumption and income in Australia Visually, on average by how much would an increase of AU$10 billion in income affect consumption Using your answer, compute the marginal propensity to consume for Australia.
*c. If you have taken a statistics class, use EXCEL or a statistical program in order to run the following regression:
What is the implied slope What does it mean Is it statistically significant
Explanation Verified
Income is that amount of money which an ...
Macroeconomics 12th Edition by Rudiger Dornbusch ,Stanley Fischer,Richard Startz
Why don’t you like this exercise?
Other Minimum 8 character and maximum 255 character
Character 255


