Macroeconomics + Economy 2009 Update 18th Edition by Campbell McConnell, Sean Masaki Flynn,Stanley Brue
Edition 18ISBN: 9780077354237Macroeconomics + Economy 2009 Update 18th Edition by Campbell McConnell, Sean Masaki Flynn,Stanley Brue
Edition 18ISBN: 9780077354237 Exercise 8
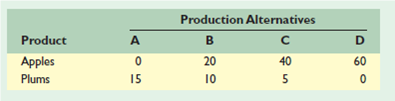
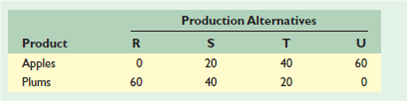
KEY QUESTION To the right are hypothetical production possibilities tables for New Zealand and Spain. Each country can produce apples and plums. Plot the production possibilities data for each of the two countries separately. Referring to your graphs, answer the following:
a. What is each country's cost ratio of producing plums and apples.
b. Which nation should specialize in which product
New Zealand's Production Possibilities Table (Millions of Bushels)
Spain's Production Possibilities Table (Millions of Bushels)
c. Show the trading possibilities lines for each nation if the actual terms of trade are 1 plum for 2 apples. (Plot these lines on your graph.)
d. Suppose the optimum product mixes before specialization and trade were alternative B in New Zealand and alternative S in Spain. What would be the gains from specialization and trade
Explanation Verified
(a) See Figure 35.4 in the chapter, less...
Macroeconomics + Economy 2009 Update 18th Edition by Campbell McConnell, Sean Masaki Flynn,Stanley Brue
Why don’t you like this exercise?
Other Minimum 8 character and maximum 255 character
Character 255


