Retailing 8th Edition by Patrick Dunne,Robert Lusch, James Carver
Edition 8ISBN: 978-1133953807Retailing 8th Edition by Patrick Dunne,Robert Lusch, James Carver
Edition 8ISBN: 978-1133953807 Exercise 1
Sonic Drive-Ins: Surviving in Difficult Times
Shawnee, Oklahoma, in 1953 was the stage for the first Sonic Drive-In restaurant to be opened. By 2010 there are 3,500 Sonic Drive-Ins in the United States, operating at year-end 2011 in 43 states. However, Oklahoma and three bordering states (Texas, Kansas, Arkansas) have nearly half of the system-wide drive-ins and Texas itself over one-third). Sonic is primarily a franchise organization with roughly 87 percent of drive-ins operated by franchisees.
Sonic views itself as in the quick-serve restaurant industry where all items are made when ordered and can be highly customized with condiments. Sonic strives to establish a unique dining experience. This experience is built around personalized Carhop service where smiling carhops deliver a customer's order to their car. Customers can eat in their vehicles or also have the option of drive-thru service or patio dining. Sonic Drive-Ins are open all day; usually from 6 or 7 a.m. until 10 p.m. or a bit later. In 2011, 49 percent of sales occurred during lunchtime and dinnertime; 23 percent in the afternoon, 16 percent after dinner and 12 percent in the morning.
The quick-service restaurant industry is highly competitive and can be significantly affected by many factors, including changes in local, regional, and national economic conditions, changes in consumer tastes, consumer concerns about nutritional quality of quick-service food, and increases in the number of, and particular locations of, competing quick-service restaurants. Increases in food and energy costs can also play a significant role.
Unfortunately, after experiencing explosive growth from the late 1980s up until the mid 2000s, performance began to falter. To put this in historical perspective, in 1984 average annual sales per drive-in were $292,000 and in 1990 they were $445,000, and by 2011 were $1,037,000, or a couple percent lower than in 2009. Clearly sales per drive-in had recently pla-teaued. Another indicator of faltering performance was that total revenues for fiscal year 2007 (fiscal year ends August 31) were $767 million but by 2011 had fallen to $546 million. It should be noted that the total revenues reflect both sales from company-owned drive-ins and franchise fees and leases that franchisees pay to Sonic (the franchisor). The accompanying exhibit provides a variety of financial and operating data on Sonic.
Sonic Corp. Selected Financial (all in 1,000) and Operating Data
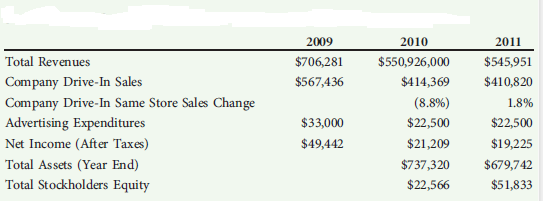
Sonic has attempted to make a variety of strategic changes to reverse its declining performance. Since 2005, it has expanded into states in the Northeast, Northwest, and along the U.S. and Canadian border. In 2010 Sonic placed increased emphasis on more high quality food. This included the introduction of real ice cream, footlong quarter pound chili cheese hot dogs, a new line of premium beef hot dogs, bigger and better burgers, and new premium burritos with meat and cheese options. In addition, there was a renewed emphasis on improved customer service and a focus on greater consistency across visits over time and across different locations (both company owned and franchised). As it ended fiscal 2011, the company announced a $30 million common stock repurchase plan effective through August 31, 2012.
1. What are some of the population, social, and economic trends that may be influencing Sonic's performance
2. Apply the "consumer shopping and purchasing model" (see Exhibit 3.7) to gain insights into how Sonic can attract more customers.
3. Evaluate whether the strategies that Sonic is pursuing to improve performance are optimal.
4. Analyze Sonic's financial performance over the last couple of years.
Note: This case was prepared as a basis for class discussion rather than to illustrate either effective or ineffective handling of a retail situation. This case is based on the authors' patronage of Sonic Drive-Ins for 30 years, parts of the 1991 Prospectus which was used to take the company public, and 2009-2011 Annual Report to Stockholders.
Shawnee, Oklahoma, in 1953 was the stage for the first Sonic Drive-In restaurant to be opened. By 2010 there are 3,500 Sonic Drive-Ins in the United States, operating at year-end 2011 in 43 states. However, Oklahoma and three bordering states (Texas, Kansas, Arkansas) have nearly half of the system-wide drive-ins and Texas itself over one-third). Sonic is primarily a franchise organization with roughly 87 percent of drive-ins operated by franchisees.
Sonic views itself as in the quick-serve restaurant industry where all items are made when ordered and can be highly customized with condiments. Sonic strives to establish a unique dining experience. This experience is built around personalized Carhop service where smiling carhops deliver a customer's order to their car. Customers can eat in their vehicles or also have the option of drive-thru service or patio dining. Sonic Drive-Ins are open all day; usually from 6 or 7 a.m. until 10 p.m. or a bit later. In 2011, 49 percent of sales occurred during lunchtime and dinnertime; 23 percent in the afternoon, 16 percent after dinner and 12 percent in the morning.
The quick-service restaurant industry is highly competitive and can be significantly affected by many factors, including changes in local, regional, and national economic conditions, changes in consumer tastes, consumer concerns about nutritional quality of quick-service food, and increases in the number of, and particular locations of, competing quick-service restaurants. Increases in food and energy costs can also play a significant role.
Unfortunately, after experiencing explosive growth from the late 1980s up until the mid 2000s, performance began to falter. To put this in historical perspective, in 1984 average annual sales per drive-in were $292,000 and in 1990 they were $445,000, and by 2011 were $1,037,000, or a couple percent lower than in 2009. Clearly sales per drive-in had recently pla-teaued. Another indicator of faltering performance was that total revenues for fiscal year 2007 (fiscal year ends August 31) were $767 million but by 2011 had fallen to $546 million. It should be noted that the total revenues reflect both sales from company-owned drive-ins and franchise fees and leases that franchisees pay to Sonic (the franchisor). The accompanying exhibit provides a variety of financial and operating data on Sonic.
Sonic Corp. Selected Financial (all in 1,000) and Operating Data
Sonic has attempted to make a variety of strategic changes to reverse its declining performance. Since 2005, it has expanded into states in the Northeast, Northwest, and along the U.S. and Canadian border. In 2010 Sonic placed increased emphasis on more high quality food. This included the introduction of real ice cream, footlong quarter pound chili cheese hot dogs, a new line of premium beef hot dogs, bigger and better burgers, and new premium burritos with meat and cheese options. In addition, there was a renewed emphasis on improved customer service and a focus on greater consistency across visits over time and across different locations (both company owned and franchised). As it ended fiscal 2011, the company announced a $30 million common stock repurchase plan effective through August 31, 2012.
1. What are some of the population, social, and economic trends that may be influencing Sonic's performance
2. Apply the "consumer shopping and purchasing model" (see Exhibit 3.7) to gain insights into how Sonic can attract more customers.
3. Evaluate whether the strategies that Sonic is pursuing to improve performance are optimal.
4. Analyze Sonic's financial performance over the last couple of years.
Note: This case was prepared as a basis for class discussion rather than to illustrate either effective or ineffective handling of a retail situation. This case is based on the authors' patronage of Sonic Drive-Ins for 30 years, parts of the 1991 Prospectus which was used to take the company public, and 2009-2011 Annual Report to Stockholders.
Explanation Verified
The decline of the sales at SD-Ins may b...
Retailing 8th Edition by Patrick Dunne,Robert Lusch, James Carver
Why don’t you like this exercise?
Other Minimum 8 character and maximum 255 character
Character 255


