Contemporary Mathematics for Business & Consumers 8th Edition by Robert Brechner,Geroge Bergeman
Edition 8ISBN: 978-1305585454Contemporary Mathematics for Business & Consumers 8th Edition by Robert Brechner,Geroge Bergeman
Edition 8ISBN: 978-1305585454 Exercise 38
Use the line chart "Widget Sales 2009-2016" to answer the following questions.
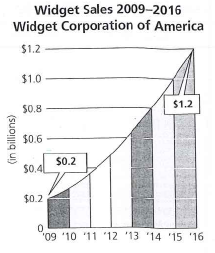
a. What was the amount of widget sales in 2009
b. In what year did widget sales reach $0.8 billion

c. What does this line graph represent
d. What variables are represented on the x-axis and the y-axis
e. What was the amount of widget sales in 2015
f. In which year did sales reach $0.6 billion
g. Calculate how much greater widget sales were in 2016 compared with 2009.
a. What was the amount of widget sales in 2009
b. In what year did widget sales reach $0.8 billion
c. What does this line graph represent
d. What variables are represented on the x-axis and the y-axis
e. What was the amount of widget sales in 2015
f. In which year did sales reach $0.6 billion
g. Calculate how much greater widget sales were in 2016 compared with 2009.
Explanation

This question doesn’t have an expert verified answer yet, let Examlex AI Copilot help.
Contemporary Mathematics for Business & Consumers 8th Edition by Robert Brechner,Geroge Bergeman
Why don’t you like this exercise?
Other Minimum 8 character and maximum 255 character
Character 255


