
Microeconomics 6th Edition by Robert Hall, Shirley Kuiper, Marc Lieberman
Edition 6ISBN: 978-1133708735Microeconomics 6th Edition by Robert Hall, Shirley Kuiper, Marc Lieberman
Edition 6ISBN: 978-1133708735 Exercise 15
The following table gives hypothetical data for the quantity of two-bedroom rental apartments demanded and supplied in Peoria,Illinois:
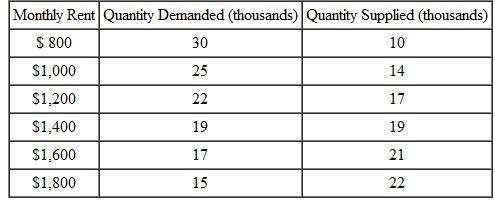 a. Graph the demand and supply curves.
b. Find the equilibrium price and quantity.
c. Explain briefly why a rent of $1,000 cannot be the equilibrium in this market.
d. Suppose a tornado destroys a significant number of apartment buildings in Peoria but doesn't affect people's desire to live there. Illustrate on your graph the effects on equilibrium price and quantity
a. Graph the demand and supply curves.b. Find the equilibrium price and quantity.
c. Explain briefly why a rent of $1,000 cannot be the equilibrium in this market.
d. Suppose a tornado destroys a significant number of apartment buildings in Peoria but doesn't affect people's desire to live there. Illustrate on your graph the effects on equilibrium price and quantity
Explanation Verified
(a)Following graph shows the demand curv...
Microeconomics 6th Edition by Robert Hall, Shirley Kuiper, Marc Lieberman
Why don’t you like this exercise?
Other Minimum 8 character and maximum 255 character
Character 255


