
Microeconomics 6th Edition by Robert Hall, Shirley Kuiper, Marc Lieberman
Edition 6ISBN: 978-1133708735Microeconomics 6th Edition by Robert Hall, Shirley Kuiper, Marc Lieberman
Edition 6ISBN: 978-1133708735 Exercise 17
The following table gives hypothetical data for the quantity of gasoline demanded and supplied in Los Angeles per month.
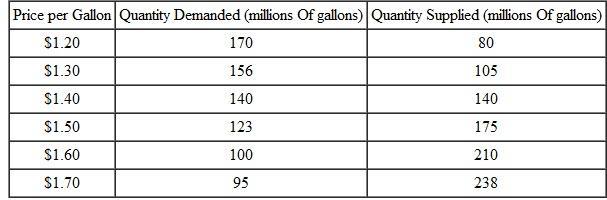 a. Graph the demand and supply curves.
b. Find the equilibrium price and quantity.
c. Illustrate on your graph how a rise in the price of automobiles would affect the gasoline market
a. Graph the demand and supply curves.b. Find the equilibrium price and quantity.
c. Illustrate on your graph how a rise in the price of automobiles would affect the gasoline market
Explanation Verified
(a)Following graph shows the demand curv...
Microeconomics 6th Edition by Robert Hall, Shirley Kuiper, Marc Lieberman
Why don’t you like this exercise?
Other Minimum 8 character and maximum 255 character
Character 255


