
Microeconomics 6th Edition by Robert Hall, Shirley Kuiper, Marc Lieberman
Edition 6ISBN: 978-1133708735Microeconomics 6th Edition by Robert Hall, Shirley Kuiper, Marc Lieberman
Edition 6ISBN: 978-1133708735 Exercise 4
The following table shows the quantities of bottled water demanded and supplied per week at different prices in a particular city:
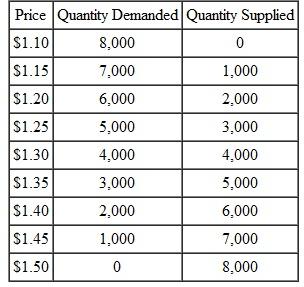 a. Draw the supply and demand curves for this market,and identify the equilibrium price and quantity.
b. Identify on your graph areas for market consumer surplus and market producer surplus when the market is in equilibrium.
c. Using your graph,calculate the dollar value of market consumer surplus,market producer surplus,and the total net benefits in the market at equilibrium.
a. Draw the supply and demand curves for this market,and identify the equilibrium price and quantity.b. Identify on your graph areas for market consumer surplus and market producer surplus when the market is in equilibrium.
c. Using your graph,calculate the dollar value of market consumer surplus,market producer surplus,and the total net benefits in the market at equilibrium.
Explanation Verified
The price and the quantity at which supp...
Microeconomics 6th Edition by Robert Hall, Shirley Kuiper, Marc Lieberman
Why don’t you like this exercise?
Other Minimum 8 character and maximum 255 character
Character 255


