Principles of Environmental Science 6th Edition by William Cunningham, Mary Cunningham
Edition 6ISBN: 978-1121779211Principles of Environmental Science 6th Edition by William Cunningham, Mary Cunningham
Edition 6ISBN: 978-1121779211 Exercise 27
Confidence Limits in the Breeding Bird Survey
A central principle of science is the recognition that all knowledge involves uncertainty. No study can observe every possible event in the universe, so there is always missing information. Scientists try to define the limits of their uncertainty, in order to allow a realistic assessment of their results. A corollary of this principle is that the more data we have, the less uncertainty we have. More data increase our confidence that our observations represent the range of possible observations.
One of the most detailed records of wildlife population trends in North America is the Breeding Bird Survey (BBS). Every June, volunteers drive more than 4,000 established 25-mile routes. They stop every half mile and count every bird they see or hear. The accumulated data from thousands of routes, over more than 40 years of the study, indicate population trends , telling which populations are increasing, decreasing, or expanding into new territory.
Because many scientists use BBS data, it is essential to communicate how much confidence there is in the data. The online BBS database reports measures of data quality, including:
• N : the number of survey routes from which population trends are calculated.
• Confidence limits : because the reported trend is an average of a small sample of year-to-year changes on routes, confidence limits tell us how close the sample's average probably is to the average for the entire population of that species. Statistically, 95 percent of all samples should fall between the confidence limits. In effect, we can be 95 percent sure that the entire population's actual trend falls between the upper and lower confidence limits.
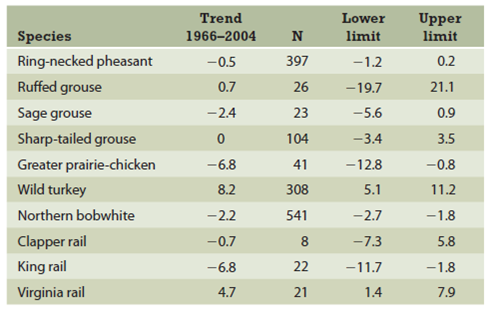
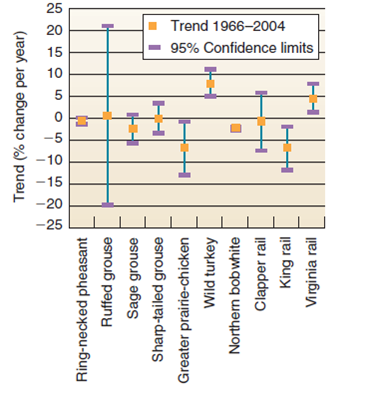
A trend of 0 would mean no change at all. When 0 falls within the confidence interval, we have little certainty that the trend is not 0. In this case, we say that the trend is not significant. How many species have trends that are not significant (at 95 percent certainty)? Can we be certain that the sharp-tailed grouse and greater prairie-chicken are changing at different rates? How about the sharp-tailed grouse and wild turkey?
A central principle of science is the recognition that all knowledge involves uncertainty. No study can observe every possible event in the universe, so there is always missing information. Scientists try to define the limits of their uncertainty, in order to allow a realistic assessment of their results. A corollary of this principle is that the more data we have, the less uncertainty we have. More data increase our confidence that our observations represent the range of possible observations.
One of the most detailed records of wildlife population trends in North America is the Breeding Bird Survey (BBS). Every June, volunteers drive more than 4,000 established 25-mile routes. They stop every half mile and count every bird they see or hear. The accumulated data from thousands of routes, over more than 40 years of the study, indicate population trends , telling which populations are increasing, decreasing, or expanding into new territory.
Because many scientists use BBS data, it is essential to communicate how much confidence there is in the data. The online BBS database reports measures of data quality, including:
• N : the number of survey routes from which population trends are calculated.
• Confidence limits : because the reported trend is an average of a small sample of year-to-year changes on routes, confidence limits tell us how close the sample's average probably is to the average for the entire population of that species. Statistically, 95 percent of all samples should fall between the confidence limits. In effect, we can be 95 percent sure that the entire population's actual trend falls between the upper and lower confidence limits.
A trend of 0 would mean no change at all. When 0 falls within the confidence interval, we have little certainty that the trend is not 0. In this case, we say that the trend is not significant. How many species have trends that are not significant (at 95 percent certainty)? Can we be certain that the sharp-tailed grouse and greater prairie-chicken are changing at different rates? How about the sharp-tailed grouse and wild turkey?
Explanation Verified
There is only one species, has trends th...
Principles of Environmental Science 6th Edition by William Cunningham, Mary Cunningham
Why don’t you like this exercise?
Other Minimum 8 character and maximum 255 character
Character 255


