Principles of Environmental Science 6th Edition by William Cunningham, Mary Cunningham
Edition 6ISBN: 978-1121779211Principles of Environmental Science 6th Edition by William Cunningham, Mary Cunningham
Edition 6ISBN: 978-1121779211 Exercise 15
Graphing Global Water Stress and Scarcity
According to the United Nations, water stress is when annual water supplies drop below 1,700 m 3 per person. Water scarcity is defined as annual water supplies below 1,000 m 3 per person. More than 2.8 billion people in 48 countries will face either water stress or scarcity conditions by 2025. Of these countries, 40 are expected to be in West Asia or Africa. By 2050, far more people could be facing water shortages, depending both on population projections and scenarios for water supplies based on global warming and consumption patterns. The following graph in this box shows an estimate for water stress and scarcity in 1995 together with three possible scenarios (high, medium, and low population projections) for 2050. You'll remember from chapter 4 that according to the 2004 UN population revision, the low projection for 2050 is about 7.6 billion, the medium projection is 8.9 billion, and the high projection is 10.6 billion.
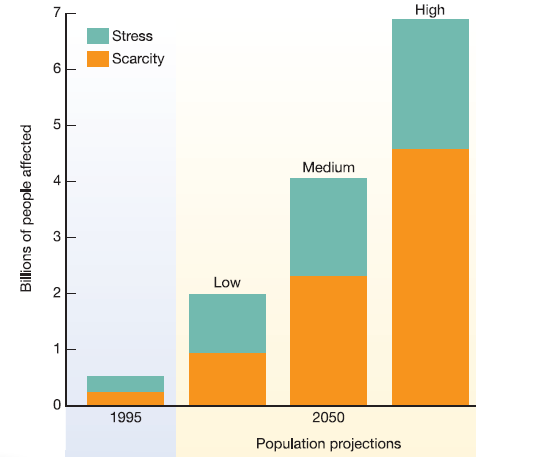
Why is the proportion of people in the scarce category so much larger in the high projection?
According to the United Nations, water stress is when annual water supplies drop below 1,700 m 3 per person. Water scarcity is defined as annual water supplies below 1,000 m 3 per person. More than 2.8 billion people in 48 countries will face either water stress or scarcity conditions by 2025. Of these countries, 40 are expected to be in West Asia or Africa. By 2050, far more people could be facing water shortages, depending both on population projections and scenarios for water supplies based on global warming and consumption patterns. The following graph in this box shows an estimate for water stress and scarcity in 1995 together with three possible scenarios (high, medium, and low population projections) for 2050. You'll remember from chapter 4 that according to the 2004 UN population revision, the low projection for 2050 is about 7.6 billion, the medium projection is 8.9 billion, and the high projection is 10.6 billion.
Why is the proportion of people in the scarce category so much larger in the high projection?
Explanation Verified
Water scarcity:
According to the United...
Principles of Environmental Science 6th Edition by William Cunningham, Mary Cunningham
Why don’t you like this exercise?
Other Minimum 8 character and maximum 255 character
Character 255


