Environmental Science: A Global ConcernEnvironmental Science: A Global Concern 11th Edition by William Cunningham, Mary Ann Cunningham
Edition 11ISBN: 978-0697806451Environmental Science: A Global ConcernEnvironmental Science: A Global Concern 11th Edition by William Cunningham, Mary Ann Cunningham
Edition 11ISBN: 978-0697806451 Exercise 15
How can you extract data from a line plot The process is simply the reverse of the way you just learned to create the graph. You draw lines from the axes to where they intersect on the graph at the point whose value you want to know.
Let's look at figure.
FIGURE
Growth of Tetrahymena.
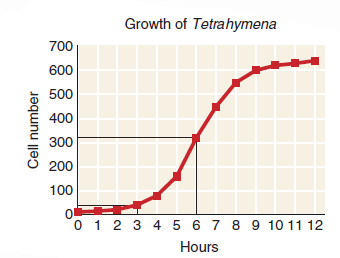
• How many cells were there at the half point of the growth curve
• How does that result compare to the cell population three hours earlier
• When did the growth of this population start to slow
A curve, such as this, that increases slowly at first but then rapidly accelerates is called a logistic curve. We'll discuss the mathematics that create this pattern in chapter 6.
Let's look at figure.
FIGURE
Growth of Tetrahymena.
• How many cells were there at the half point of the growth curve
• How does that result compare to the cell population three hours earlier
• When did the growth of this population start to slow
A curve, such as this, that increases slowly at first but then rapidly accelerates is called a logistic curve. We'll discuss the mathematics that create this pattern in chapter 6.
Explanation Verified
A curve that increases at a slow rate an...
Environmental Science: A Global ConcernEnvironmental Science: A Global Concern 11th Edition by William Cunningham, Mary Ann Cunningham
Why don’t you like this exercise?
Other Minimum 8 character and maximum 255 character
Character 255


