
Environmental Science: A Global ConcernEnvironmental Science: A Global Concern 11th Edition by William Cunningham, Mary Ann Cunningham
Edition 11ISBN: 978-0697806451Environmental Science: A Global ConcernEnvironmental Science: A Global Concern 11th Edition by William Cunningham, Mary Ann Cunningham
Edition 11ISBN: 978-0697806451 Exercise 12
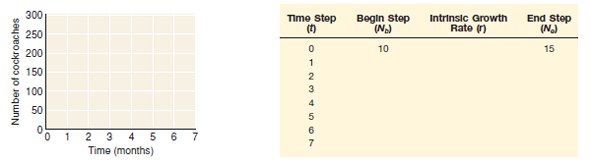
Exponential growth occurs in a series of time steps-days, months, years, or generations. Imagine cockroaches in a room multiplying (or some other species, if you must). Picture a population of ten cockroaches that together produce enough young to increase at a rate of 150 percent per month. What is r for this population
To find out how this population grows, fill out the table shown. ( Hint: r remains constant.) Remember, for time step 0 (the first month), you begin with ten roaches, and end ( Ne ) with a larger number that depends on r , the intrinsic rate of growth. The beginning of the second time step (1) starts with the number at the end of step 0. Round N to the nearest whole number. When you are done, graph the results. At the end of 7 months, how large did this population become What is the shape of the growth curve
The previous data analysis lets you work through an example of population growth by hand, which is an important strategy for understanding the equations you've seen in this chapter.
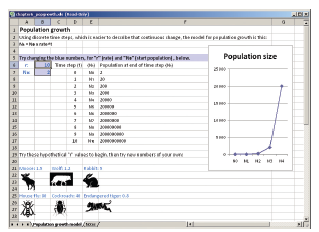
Now try experimenting with more growth rates in an Excel "model." What value of r makes the graph extremely steep What value makes it flat Can you model a declining population
Go to www.mhhe.com/cunningham11e, and find the Data Analysis option for this chapter. There you can download an Excel workbook and experiment with different growth rates.
To find out how this population grows, fill out the table shown. ( Hint: r remains constant.) Remember, for time step 0 (the first month), you begin with ten roaches, and end ( Ne ) with a larger number that depends on r , the intrinsic rate of growth. The beginning of the second time step (1) starts with the number at the end of step 0. Round N to the nearest whole number. When you are done, graph the results. At the end of 7 months, how large did this population become What is the shape of the growth curve
The previous data analysis lets you work through an example of population growth by hand, which is an important strategy for understanding the equations you've seen in this chapter.
Now try experimenting with more growth rates in an Excel "model." What value of r makes the graph extremely steep What value makes it flat Can you model a declining population
Go to www.mhhe.com/cunningham11e, and find the Data Analysis option for this chapter. There you can download an Excel workbook and experiment with different growth rates.
Explanation Verified
Population - means all the individuals o...
Environmental Science: A Global ConcernEnvironmental Science: A Global Concern 11th Edition by William Cunningham, Mary Ann Cunningham
Why don’t you like this exercise?
Other Minimum 8 character and maximum 255 character
Character 255


