Environmental Science: A Global ConcernEnvironmental Science: A Global Concern 11th Edition by William Cunningham, Mary Ann Cunningham
Edition 11ISBN: 978-0697806451Environmental Science: A Global ConcernEnvironmental Science: A Global Concern 11th Edition by William Cunningham, Mary Ann Cunningham
Edition 11ISBN: 978-0697806451 Exercise 20
Is it possible to show relationships between two dependent variables on the same graph Sometimes that's desirable when you want to make comparisons between them. The graph shown here does just that. It's a description of how people perceive different risks. We judge the severity of risks based on how familiar they are and how much control we have over our exposure. The Y-axis represents how mysterious, unknown or delayed the risk seems to be. Things that are unobservable, unknown to those exposed, delayed in their effects, and unfamiliar or unknown to science tend to be more greatly feared than those that are observable, known, immediate, familiar, and known to science. The X-axis represents a measure of dread, which combines how much control we feel we have over the risk, how terrible the results could potentially be, and how equitably the risks are distributed. The size of the symbol for each risk indicates the combined effect of these two variables. Notice that things such as DNA technology or nuclear waste, which have high levels of both mystery and dread, tend to be regarded with the greatest fear, while familiar, voluntary, personally rewarding behaviors such as riding in automobiles or on bicycles, or drinking alcohol are thought to be relatively minor risks. Actuarial experts (statisticians who gather mortality data) would tell you that automobiles, bicycles, and alcohol have killed far more people (so far) than DNA technology or radioactive waste. But this isn't just a question of data. It's a reflection of how much we fear various risks. Notice that this is a kind of scatter plot mapping categories of data that have no temporal sequence. Still, you can draw some useful inferences from this sort of graphic presentation.
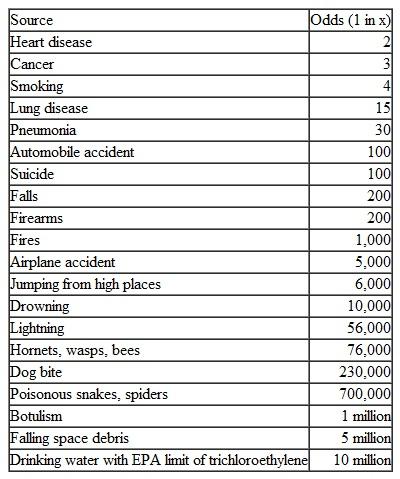
Compare the graph with table 8.4.
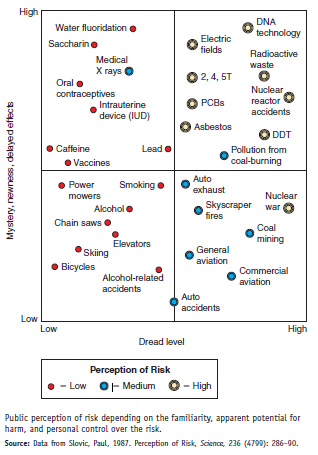
How do the lifetime risks for smoking and auto accidents calculated by the National Safety Council correspond to the perception of risk in this graph
Table 8.4
Lifetime Chances of Dying in the United States
Compare the graph with table 8.4.
How do the lifetime risks for smoking and auto accidents calculated by the National Safety Council correspond to the perception of risk in this graph
Table 8.4
Lifetime Chances of Dying in the United States
Explanation Verified
The graph that is shown relates two fact...
Environmental Science: A Global ConcernEnvironmental Science: A Global Concern 11th Edition by William Cunningham, Mary Ann Cunningham
Why don’t you like this exercise?
Other Minimum 8 character and maximum 255 character
Character 255


