Cost Management: A Strategic Emphasis 7th Edition by Edward Blocher,David Stout ,Paul Juras,Gary Cokins
Edition 7ISBN: 978-0077733773Cost Management: A Strategic Emphasis 7th Edition by Edward Blocher,David Stout ,Paul Juras,Gary Cokins
Edition 7ISBN: 978-0077733773 Exercise 48
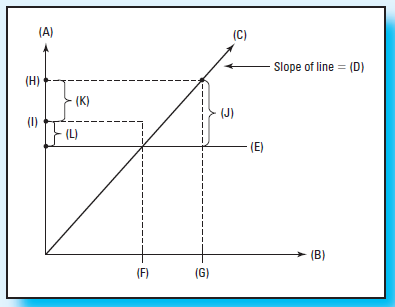
Graphical Analysis-Fixed Overhead Cost Variances (Continuation of 15-25) The controller is satisfied with the graphical representation you prepared in conjunction with Exercise 15-25. She thinks this graphical representation of variable overhead variances will be well received by operating managers of the company. As such, she asks you to prepare an accompanying graph for fixed overhead variances. She indicates that you should assume the following in constructing your graph: (1) fixed overhead is applied to production on the basis of standard machine hours allowed for the output of the period (the standard total overhead cost per machine hour is $10, while the standard variable overhead cost per machine hour is $6); (2) during the example case, there was a favorable production volume variance and an unfavorable spending (budget) variance for fixed overhead. Based on these assumptions, the controller has asked you to complete the following graph.
Required
1. (A) =
2. (B) =
3. (C) =
4. (D) =
5. (E) =
6. (F) =
7. (G) =
8. (H) =
9. (I) =
10. Vertical distance (J) =
11. Vertical distance (K) =
12. Vertical distance (L) =
Required
1. (A) =
2. (B) =
3. (C) =
4. (D) =
5. (E) =
6. (F) =
7. (G) =
8. (H) =
9. (I) =
10. Vertical distance (J) =
11. Vertical distance (K) =
12. Vertical distance (L) =
Explanation Verified
Cost Variance and Capacity Management:
...
Cost Management: A Strategic Emphasis 7th Edition by Edward Blocher,David Stout ,Paul Juras,Gary Cokins
Why don’t you like this exercise?
Other Minimum 8 character and maximum 255 character
Character 255


