A Visual Approach to SPSS for Windows 2nd Edition by Leonard Stern
Edition 2ISBN: 978-0205706051A Visual Approach to SPSS for Windows 2nd Edition by Leonard Stern
Edition 2ISBN: 978-0205706051 Exercise 4
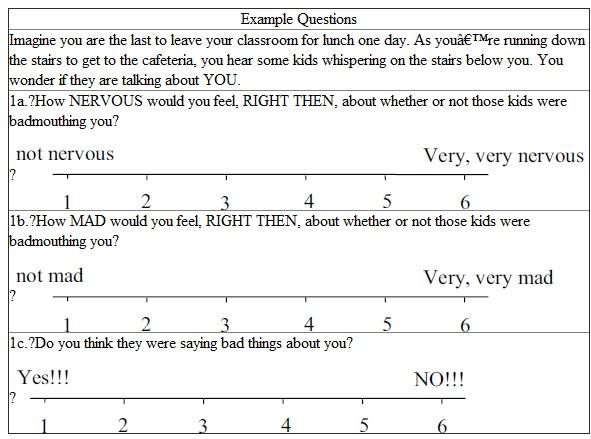
Data gathered by Patricia K. Kerig and Kurt K. Stellwagen at the University of North Carolina at Chapel Hill was obtained both from children diagnosed primarily with externalizing behavior disorders at a large psychiatric institution in North Carolina and a control sample of children. The 18-item questionnaire (Ayduk et al., 2000) included six questions that probed for anxious rejection sensitivity (see example question 1a in the table below), six that probed for angry rejection sensitivity (e.g., question 1b), and six that probed for a rejection sensitive attributional bias (e.g., question 1c). Perform the analyses described below using data in file ConductdvsControl.sav , available at the website for this text at the address http://www.pearsonhighered.com/stern2e. The data appear here by permission of Professors Kerig (now at Miami University) and Stellwagen (now at Eastern Washington University). Do three discriminant analyses. In the first, use the six questions that probed for anxious rejection sensitivity (variables crsq1_a - crsq6_a ) to predict group membership (variable Category with values 0 = control, 1 = externalizing behavior disorder). In the second discriminant analysis, use the six questions that probed for angry rejection sensitivity (variables crsq1_b - crsq6_b ) to predict group membership. In the third discriminant analysis, use the six questions that probed for rejection sensitive attributional bias (variables crsq1_c - crsq6_c ) to predict group membership. In conducting the analyses, have the program compute prior probabilities based on group sizes. For each analysis, answer these questions:
1. Does the discriminant function significantly aid prediction of group membership
2. What is the overall percent correct classification rate using the classification function
1. Does the discriminant function significantly aid prediction of group membership
2. What is the overall percent correct classification rate using the classification function
Explanation Verified
From the given information we have six v...
A Visual Approach to SPSS for Windows 2nd Edition by Leonard Stern
Why don’t you like this exercise?
Other Minimum 8 character and maximum 255 character
Character 255


