Managerial Economics & Business Strategy 8th Edition by Michael Baye,Jeff Prince
Edition 8ISBN: 978-1259129858Managerial Economics & Business Strategy 8th Edition by Michael Baye,Jeff Prince
Edition 8ISBN: 978-1259129858 Exercise 13
Suppose the Kalamazoo Brewing Company (KBC) currently sells its microbrews in a seven-state area: Illinois, Indiana, Michigan, Minnesota, Mississippi, Ohio, and Wisconsin. The company's marketing department has collected data from its distributors in each state. These data consist of the
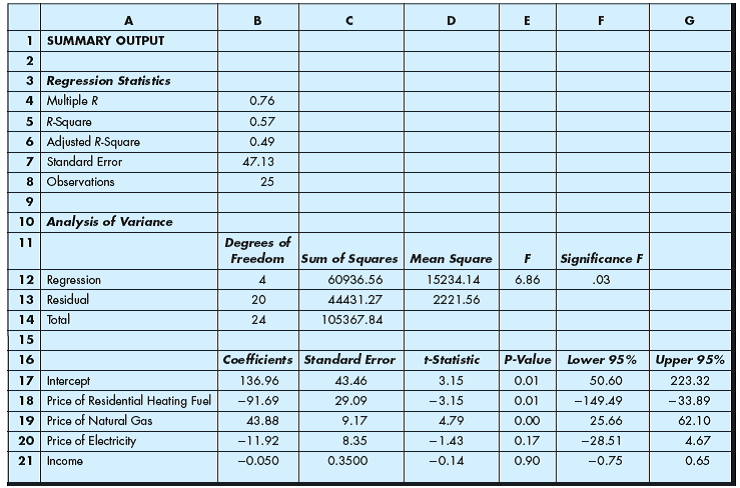
quantity and price (per case) of microbrews sold in each state, as well as the average income (in thousands of dollars) of consumers living in various regions of each state. The data for each state are available online at www.mhhe.com/baye8e under the filename Q19.xls, where there are multiple tabs at the bottom of the spreadsheet, each referring to one of the seven states selling the Kalamazoo Brewing Company's microbrews. Assuming that the underlying demand relation is a linear function of price and income, use your spreadsheet program to obtain least squares estimates of the state's demand for KBC microbrews. Print the regression output and provide an economic interpretation of the regression results.
quantity and price (per case) of microbrews sold in each state, as well as the average income (in thousands of dollars) of consumers living in various regions of each state. The data for each state are available online at www.mhhe.com/baye8e under the filename Q19.xls, where there are multiple tabs at the bottom of the spreadsheet, each referring to one of the seven states selling the Kalamazoo Brewing Company's microbrews. Assuming that the underlying demand relation is a linear function of price and income, use your spreadsheet program to obtain least squares estimates of the state's demand for KBC microbrews. Print the regression output and provide an economic interpretation of the regression results.
Explanation Verified
Assuming the demand function to be linea...
Managerial Economics & Business Strategy 8th Edition by Michael Baye,Jeff Prince
Why don’t you like this exercise?
Other Minimum 8 character and maximum 255 character
Character 255


