Managerial Economics & Organizational Architecture 6th Edition by James Brickley , Clifford Smith ,Jerold Zimmerman
Edition 6ISBN: 978-0073523149Managerial Economics & Organizational Architecture 6th Edition by James Brickley , Clifford Smith ,Jerold Zimmerman
Edition 6ISBN: 978-0073523149 Exercise 1
ANALYZING MANAGERIAL DECISIONS: Choosing the Mix of People and Machines in a Retail Supercenter
You manage a large retail supercenter that sells groceries and other products to 30,000 customers per week. Currently, you employ 80 check-out clerks and 10 automated check-out machines (customers scan and pay for their purchases without a clerk's assistance). Each clerk is paid wages and fringe benefits of $800 per week. It also costs you $800 per week to lease each machine (price includes installation, software support, and servicing). A vendor has offered to lease you additional machines at this price. You estimate that by leasing 10 more machines you can meet your service requirements with 30 fewer clerks. Should you lease the additional machines or continue to service your customers with your current input mix
You conduct additional analysis and estimate that you can service the 30,000 customers with the following combinations of clerks and machines. Calculate the total costs for each of these combinations. What combination of inputs serves the customers at the lowest possible cost
Plot the input combinations in the table on a graph that contains clerks on the vertical axis and machines on the horizontal axis. Connect the points by lines to approximate an isoquant as pictured in Figure 5.6. Add the cost minimizing isocost curve to the graph (you can derive this line from the input prices and the total cost of the low-cost input combination). How do the slopes of the isocost curve and isoquant compare at the optimal input combination
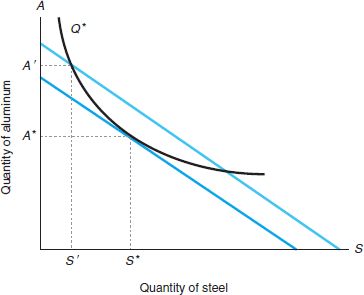
Figure 5.6: Cost Minimization
The input mix that minimizes the cost of producing any given output, Q * , occurs where an isocost line is tangent to the relevant isoquant. In this example, the tangency occurs at ( S * , A * ). The firm would prefer to be on an isocost line closer to the origin. However, the firm would not have sufficient resources to produce Q *. The firm could produce Q * using other input mixes, such as (S', A' ). However, the cost of production would increase.
You manage a large retail supercenter that sells groceries and other products to 30,000 customers per week. Currently, you employ 80 check-out clerks and 10 automated check-out machines (customers scan and pay for their purchases without a clerk's assistance). Each clerk is paid wages and fringe benefits of $800 per week. It also costs you $800 per week to lease each machine (price includes installation, software support, and servicing). A vendor has offered to lease you additional machines at this price. You estimate that by leasing 10 more machines you can meet your service requirements with 30 fewer clerks. Should you lease the additional machines or continue to service your customers with your current input mix
You conduct additional analysis and estimate that you can service the 30,000 customers with the following combinations of clerks and machines. Calculate the total costs for each of these combinations. What combination of inputs serves the customers at the lowest possible cost
Plot the input combinations in the table on a graph that contains clerks on the vertical axis and machines on the horizontal axis. Connect the points by lines to approximate an isoquant as pictured in Figure 5.6. Add the cost minimizing isocost curve to the graph (you can derive this line from the input prices and the total cost of the low-cost input combination). How do the slopes of the isocost curve and isoquant compare at the optimal input combination
Figure 5.6: Cost Minimization
The input mix that minimizes the cost of producing any given output, Q * , occurs where an isocost line is tangent to the relevant isoquant. In this example, the tangency occurs at ( S * , A * ). The firm would prefer to be on an isocost line closer to the origin. However, the firm would not have sufficient resources to produce Q *. The firm could produce Q * using other input mixes, such as (S', A' ). However, the cost of production would increase.
Explanation Verified
Isoquant refers to a curve which is the ...
Managerial Economics & Organizational Architecture 6th Edition by James Brickley , Clifford Smith ,Jerold Zimmerman
Why don’t you like this exercise?
Other Minimum 8 character and maximum 255 character
Character 255


