
Business and Administrative Communication 10th Edition by Kitty Locker,Donna Kienzler
Edition 10ISBN: 978-0077419530Business and Administrative Communication 10th Edition by Kitty Locker,Donna Kienzler
Edition 10ISBN: 978-0077419530 Exercise 11
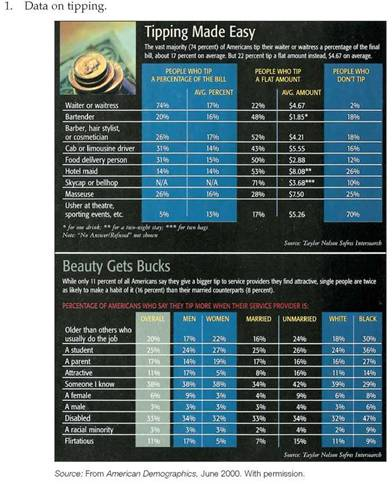
Interpreting Data
As your instructor directs,
a. Identify at least five stories in one or more of the following data sets.
b. Create visuals for three of the stories.
c. Write a memo to your instructor explaining why you chose these stories and why you chose these visuals to display them.
d. Write a memo to some group that might be interested in your findings, presenting your visuals as part of a short report. Possible groups include career counselors, radio stations, advertising agencies, and Mothers Against Drunk Driving.
e. Brainstorm additional stories you could tell with additional data. Specify the kind of data you would need.

*Significantly different from 2005.
Source: "Curriculum Levels Completed, by Gender," in U.S. Department of Education, institute of Education Sciences, National Center for Education Statistics, High School Transcript Study (HSTS), various years, 1990-2005, http://nationsreportcard.gov/hsts_2005/hs_stu_5b_2.asp (accessed May 5, 2009).

*Significantly different from 2005.
Source: "Trend in Grade Point Average, by Gender," in U.S. Department of Education, institute of Education Sciences, National Center for Education Statistics, High School Transcript Study (HSTS), various years, 1990-2005, http://nationsreportcard.gov/hsts_2005/hs_stu_5b_3.asp (accessed May 5, 2009).

*Significantly different from 2005.
Source: "Trend in Twelfth-Grade Average NAEP Reading Scores," in U.S. Department of Education, institute of Education Sciences, National Center for Education Statistics, High School Transcript Study (HSTS), various years, 1990-2005, http://nationsreportcard.gov/reading_math_grade12_2005/s0202.asp (accessed May 5, 2009).
As your instructor directs,
a. Identify at least five stories in one or more of the following data sets.
b. Create visuals for three of the stories.
c. Write a memo to your instructor explaining why you chose these stories and why you chose these visuals to display them.
d. Write a memo to some group that might be interested in your findings, presenting your visuals as part of a short report. Possible groups include career counselors, radio stations, advertising agencies, and Mothers Against Drunk Driving.
e. Brainstorm additional stories you could tell with additional data. Specify the kind of data you would need.
*Significantly different from 2005.
Source: "Curriculum Levels Completed, by Gender," in U.S. Department of Education, institute of Education Sciences, National Center for Education Statistics, High School Transcript Study (HSTS), various years, 1990-2005, http://nationsreportcard.gov/hsts_2005/hs_stu_5b_2.asp (accessed May 5, 2009).
*Significantly different from 2005.
Source: "Trend in Grade Point Average, by Gender," in U.S. Department of Education, institute of Education Sciences, National Center for Education Statistics, High School Transcript Study (HSTS), various years, 1990-2005, http://nationsreportcard.gov/hsts_2005/hs_stu_5b_3.asp (accessed May 5, 2009).
*Significantly different from 2005.
Source: "Trend in Twelfth-Grade Average NAEP Reading Scores," in U.S. Department of Education, institute of Education Sciences, National Center for Education Statistics, High School Transcript Study (HSTS), various years, 1990-2005, http://nationsreportcard.gov/reading_math_grade12_2005/s0202.asp (accessed May 5, 2009).
Explanation

This question doesn’t have an expert verified answer yet, let Examlex AI Copilot help.
Business and Administrative Communication 10th Edition by Kitty Locker,Donna Kienzler
Why don’t you like this exercise?
Other Minimum 8 character and maximum 255 character
Character 255


