
An Introduction to Management Science 13th Edition by David Anderson,Dennis Sweeney ,Thomas Williams ,Jeffrey Camm, Kipp Martin
Edition 13ISBN: 978-1439043271An Introduction to Management Science 13th Edition by David Anderson,Dennis Sweeney ,Thomas Williams ,Jeffrey Camm, Kipp Martin
Edition 13ISBN: 978-1439043271 Exercise 5
This case is based on the Management Science in Action, Pricing for Environmental Compliance in the Auto Industry In this case we build a model similar to the one built for General Motors. The CAFE requirement on fleet miles per gallon is based on an average. The harmonic average is used to calculate the CAFE requirement on average miles per gallon.
In order to understand the harmonic average, assume that there is a passenger car and a light truck. The passenger car gets 30 miles per gallon (MPG) and the light truck gets 20 miles per gallon (MPG). Assume each vehicle is driven exactly one mile. Then the passenger car consume gallon of gasoline in driving one mile and the light truck consumes
  gallon of gasoline in driving one mile. The amount of gasoline consumed in total is
The average MPG of the two vehicles calculated the"normal way" is (30 + 20)/2 = 25 MPG. If both vehicles are "average," and each vehicle is driven exactly one mile, then the total gasoline consumption is
Because is not equal to
  , the total gas consumption of two "average vehicles" driving exactly one mile is not equal to the total gas consumption of each of the original vehicles driving exactly one mile. This is unfortunate. In order to make it easy for the government to impose and enforce MPG constraints on the auto companies, it would be nice to have a single target value MPG that every company in the auto industry must meet. As just illustrated, there is a problem with requiring an average MPG on the industry because it will incorrectly estimate the gas mileage consumption of the fleet. Fortunately, there is a statistic called the harmonic average so that total gas consumption by harmonic average vehicles is equal to gas consumption of the actual vehicles.
For simplicity, first assume that there are two types of vehicles in the fleet, passenger cars and light trucks. If there is one passenger car getting 30 miles per gallon and there is one light trucks getting 20 miles per gallon, the harmonic average of these two vehicles is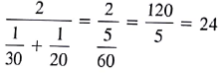
If each vehicle were to drive exactly one mile, each vehicle would consume gallon of gasoline for a total of
  gallon of gasoline. In this case each "average" of each vehicle driving exactly one mile results in total gas consumption of each vehicle with a different MPG rating driving exactly one mile.
If there are three passenger vehicles and two lights trucks, the harmonic average is given by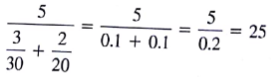
In general, when calculating the harmonic average, the numerator is the total number of vehicles. The denominator is the sum of two terms. Each term is the ratio of the number of vehicles in that class to the MPG of cars in that class. For example, the first ratio in the denominator is because there are 3 cars (the numerator) each getting 30 MPG (the de- nominator). These calculations are illustrated in Figure 8.17.
Based on Figure 8.17, if each of the 5 cars is average and drives exactly one mile, gallon of gas is consumed. If three cars gelling 30 MPG drive exactly one mile each and two cars getting 20 MPG drive exactly one mile, then
  gallon is consumed. Thus, the average cars exactly duplicate the gas consumption of the fleet with varying MPG.
FIGURE 8.17 AN EXCEL SPREADSSHEET WITH CAFE CALCULATION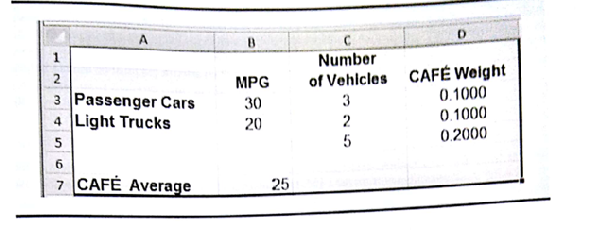
Now assume that the demand function for passenger car is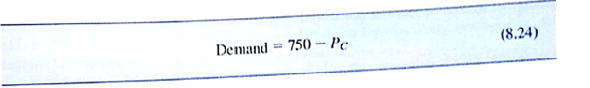
Where p c is the of a passenger car. Similarly the demand function for light trucks is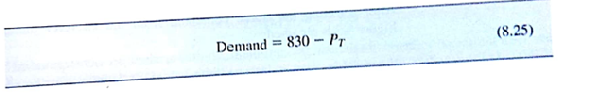
where P T is the price of a light truck.
Managerial Report
1. Using the formulas given in (8.24) and (8.25), develop an expression for the total profit contribution of the total profit contribution as a function of the price of cars and the price of light trucks.
2. Using Excel Solver or LINGO, find the price for each car so that the total profit contribution is minimized.
3. Given the prices determined in Question 2, calculate the number of passenger cars sold and the number of light trucks sold.
4. Duplicates the spreadsheet in figure 8.17. Your spreadsheet should have formulas in cells D3:D5 and B7 and be able to calculate the harmonic (CAFE) average for any MPG rating and any number of vehicles in each category.
5. Again, assume that passenger cars get 30MPG and light trucks get 20MPG; calculation late the CAFE average for the size from part (3).
6. IF you do the calculation in part (5) correctly the CAFE average of the fleet is 23.57. add a constrain that the fleet must be 25MPG and resolve the model to get the maximum total profit contribution subject to meeting the CAFE constraint.
In order to understand the harmonic average, assume that there is a passenger car and a light truck. The passenger car gets 30 miles per gallon (MPG) and the light truck gets 20 miles per gallon (MPG). Assume each vehicle is driven exactly one mile. Then the passenger car consume
gallon of gasoline in driving one mile and the light truck consumes gallon of gasoline in driving one mile. The amount of gasoline consumed in total is The average MPG of the two vehicles calculated the"normal way" is (30 + 20)/2 = 25 MPG. If both vehicles are "average," and each vehicle is driven exactly one mile, then the total gasoline consumption is
Because
is not equal to , the total gas consumption of two "average vehicles" driving exactly one mile is not equal to the total gas consumption of each of the original vehicles driving exactly one mile. This is unfortunate. In order to make it easy for the government to impose and enforce MPG constraints on the auto companies, it would be nice to have a single target value MPG that every company in the auto industry must meet. As just illustrated, there is a problem with requiring an average MPG on the industry because it will incorrectly estimate the gas mileage consumption of the fleet. Fortunately, there is a statistic called the harmonic average so that total gas consumption by harmonic average vehicles is equal to gas consumption of the actual vehicles.For simplicity, first assume that there are two types of vehicles in the fleet, passenger cars and light trucks. If there is one passenger car getting 30 miles per gallon and there is one light trucks getting 20 miles per gallon, the harmonic average of these two vehicles is
If each vehicle were to drive exactly one mile, each vehicle would consume
gallon of gasoline for a total of gallon of gasoline. In this case each "average" of each vehicle driving exactly one mile results in total gas consumption of each vehicle with a different MPG rating driving exactly one mile.If there are three passenger vehicles and two lights trucks, the harmonic average is given by
In general, when calculating the harmonic average, the numerator is the total number of vehicles. The denominator is the sum of two terms. Each term is the ratio of the number of vehicles in that class to the MPG of cars in that class. For example, the first ratio in the denominator is
because there are 3 cars (the numerator) each getting 30 MPG (the de- nominator). These calculations are illustrated in Figure 8.17.Based on Figure 8.17, if each of the 5 cars is average and drives exactly one mile,
gallon of gas is consumed. If three cars gelling 30 MPG drive exactly one mile each and two cars getting 20 MPG drive exactly one mile, then gallon is consumed. Thus, the average cars exactly duplicate the gas consumption of the fleet with varying MPG.FIGURE 8.17 AN EXCEL SPREADSSHEET WITH CAFE CALCULATION
Now assume that the demand function for passenger car is
Where p c is the of a passenger car. Similarly the demand function for light trucks is
where P T is the price of a light truck.
Managerial Report
1. Using the formulas given in (8.24) and (8.25), develop an expression for the total profit contribution of the total profit contribution as a function of the price of cars and the price of light trucks.
2. Using Excel Solver or LINGO, find the price for each car so that the total profit contribution is minimized.
3. Given the prices determined in Question 2, calculate the number of passenger cars sold and the number of light trucks sold.
4. Duplicates the spreadsheet in figure 8.17. Your spreadsheet should have formulas in cells D3:D5 and B7 and be able to calculate the harmonic (CAFE) average for any MPG rating and any number of vehicles in each category.
5. Again, assume that passenger cars get 30MPG and light trucks get 20MPG; calculation late the CAFE average for the size from part (3).
6. IF you do the calculation in part (5) correctly the CAFE average of the fleet is 23.57. add a constrain that the fleet must be 25MPG and resolve the model to get the maximum total profit contribution subject to meeting the CAFE constraint.
Explanation

This question doesn’t have an expert verified answer yet, let Examlex AI Copilot help.
An Introduction to Management Science 13th Edition by David Anderson,Dennis Sweeney ,Thomas Williams ,Jeffrey Camm, Kipp Martin
Why don’t you like this exercise?
Other Minimum 8 character and maximum 255 character
Character 255


