
An Introduction to Management Science 13th Edition by David Anderson,Dennis Sweeney ,Thomas Williams ,Jeffrey Camm, Kipp Martin
Edition 13ISBN: 978-1439043271An Introduction to Management Science 13th Edition by David Anderson,Dennis Sweeney ,Thomas Williams ,Jeffrey Camm, Kipp Martin
Edition 13ISBN: 978-1439043271 Exercise 2
The following table reports the percentage of stocks in a portfolio for nine quarters from 2007 to 2009: 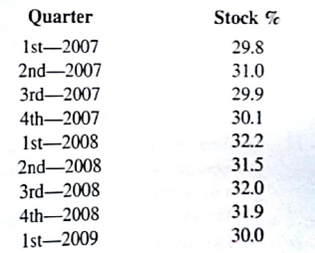
a. Construct a time series plot. What type of pattern exists in the data?
b. Use exponential smoothing to forecast this tune series. Using Excel Solver or LINGO find the value of ? minimizes the sum of squared error.
c. What is the forecast of the percentage of stocks in a typical portfolio for the second quarter of 2009?
Explanation Verified
a)Construct a time series plot using exc...
An Introduction to Management Science 13th Edition by David Anderson,Dennis Sweeney ,Thomas Williams ,Jeffrey Camm, Kipp Martin
Why don’t you like this exercise?
Other Minimum 8 character and maximum 255 character
Character 255


