An Introduction to Management Science 13th Edition by David Anderson,Dennis Sweeney ,Thomas Williams ,Jeffrey Camm, Kipp Martin
Edition 13ISBN: 978-1439043271An Introduction to Management Science 13th Edition by David Anderson,Dennis Sweeney ,Thomas Williams ,Jeffrey Camm, Kipp Martin
Edition 13ISBN: 978-1439043271 Exercise 26
The quarterly sales data number of copies sold) for a college textbook over the past three years follow: 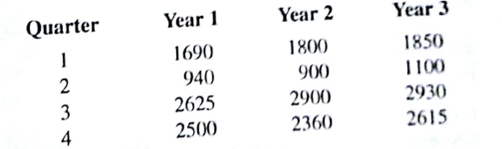
a. Construct a time series plot. What type of pattern exits in the data?
b. Use an Excel or LINGO model with dummy variables as follow to develop an equation to account for seasonal effects in the data. Qtr1 = 1 if Quarter 1, 0 otherwise; Qtr2 = 1 if Quarter 2, 0 otherwise; Qtr3 = 1 if Quarter 3, 0 otherwise.
c. Compute the quarterly forecasts for next year.
d. Let t = 1 to refer to the observation in quarter 1 of year 1; t = 2 to refer to the observation in quarter 2 of year 1;... and t = 12 to refer to the observation in quarter 4 of year 3. Using the dummy variables defined in part (b) and t , develop an equation to account for seasonal effects and any linear trend in the time series. Based upon the seasonal effects in the data and linear trend, compute the quarterly forecasts for next year.
Explanation Verified
Construct a time series plot using excel...
An Introduction to Management Science 13th Edition by David Anderson,Dennis Sweeney ,Thomas Williams ,Jeffrey Camm, Kipp Martin
Why don’t you like this exercise?
Other Minimum 8 character and maximum 255 character
Character 255


