
An Introduction to Management Science 13th Edition by David Anderson,Dennis Sweeney ,Thomas Williams ,Jeffrey Camm, Kipp Martin
Edition 13ISBN: 978-1439043271An Introduction to Management Science 13th Edition by David Anderson,Dennis Sweeney ,Thomas Williams ,Jeffrey Camm, Kipp Martin
Edition 13ISBN: 978-1439043271 Exercise 32
South Shore Construction builds permanent docks and seawalls along the southern shore of Long Island. New York. Although the firm has been in business only five years, revenue has increased from $308,000 in the first year of operation to $1,084,000 in the most recent year. The following data show the quarterly sales revenue in thousands of dollars: 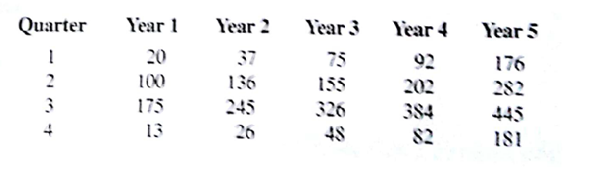
a. Construct a time series plot. What type of pattern exits in the data?
b. Use an Excel or LINGO model with dummy variables as follow to develop an equation to account for seasonal effects in the data. Qtr1 = 1 if Quarter 1, 0 otherwise; Qtr2 = 1 if Quarter 2, 0 otherwise; Qtr3 = 1 if Quarter 3, 0 otherwise.
c. Let Period = 1 to refer to the observation in quarter 1 of year 1; Period = 2 to refer to the observation in quarter 2 of year 1;... and Period = 20 refer to the observation in quarter 4 of year 5. Using the dummy variables defined in part (b) and Period, develop an equation to account for seasonal effects and any linear trend in the time series. Based upon the seasonal effects in the data and linear trend, compute estimates of quarterly sale for year 6.
Explanation Verified
Construct a time series plot using excel...
An Introduction to Management Science 13th Edition by David Anderson,Dennis Sweeney ,Thomas Williams ,Jeffrey Camm, Kipp Martin
Why don’t you like this exercise?
Other Minimum 8 character and maximum 255 character
Character 255


