Managing for Quality and Performance Excellence 10th Edition by James Evans ,William Lindsay
Edition 10ISBN: 978-1305662544Managing for Quality and Performance Excellence 10th Edition by James Evans ,William Lindsay
Edition 10ISBN: 978-1305662544 Exercise 50
Many one-tenth scale remote control (RC) model car racing enthusiasts believe that spending more money on high-quality batteries, using expensive gold-plated connectors, and storing batteries at low temperatures will improve battery life performance in a race. To test this hypothesis, an electrical test circuit was constructed to measure battery discharge under different configurations. Each factor (battery type, connector type, and temperature) was evaluated at two levels, resulting in 2 3 = 8 experimental conditions, shown in Table 6.5.
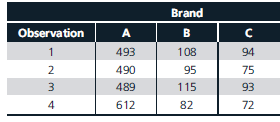
Model race car enthusiasts are also interested in determining whether any significant differences exist between various brands of batteries. Understanding possible differences in battery performance could be a first step in examining whether connection or temperature has an effect on performance. Table 6.6 shows discharge times for three different brands of batteries, gathered through a measurement process.
TABLE 6.5 Experimental Design for Testing Battery Performance
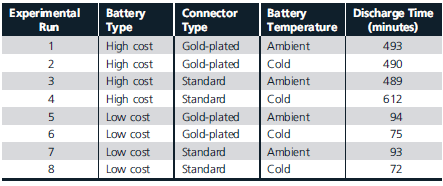
TABLE 6.6 Battery Discharge Time Data by Brand
Use the data in Table 6.5 to find the main effects, interactions, and interaction plots for the three factors (use the Excel template 2x3 Factorial Experiment.xlsx on the Student Companion Site). Thoroughly explain your results.
Model race car enthusiasts are also interested in determining whether any significant differences exist between various brands of batteries. Understanding possible differences in battery performance could be a first step in examining whether connection or temperature has an effect on performance. Table 6.6 shows discharge times for three different brands of batteries, gathered through a measurement process.
TABLE 6.5 Experimental Design for Testing Battery Performance
TABLE 6.6 Battery Discharge Time Data by Brand
Use the data in Table 6.5 to find the main effects, interactions, and interaction plots for the three factors (use the Excel template 2x3 Factorial Experiment.xlsx on the Student Companion Site). Thoroughly explain your results.
Explanation

This question doesn’t have an expert verified answer yet, let Examlex AI Copilot help.
Managing for Quality and Performance Excellence 10th Edition by James Evans ,William Lindsay
Why don’t you like this exercise?
Other Minimum 8 character and maximum 255 character
Character 255


