
Managing for Quality and Performance Excellence 10th Edition by James Evans ,William Lindsay
Edition 10ISBN: 978-1305662544Managing for Quality and Performance Excellence 10th Edition by James Evans ,William Lindsay
Edition 10ISBN: 978-1305662544 Exercise 54
A Printed Circuit Assembly-Encoder (PCA-Encoder) is a critical component for the base carriage assembly for a printer. The PCA-Encoder is produced by putting the electronic components on printed circuit boards (panels) that contain eight small boards, and then soldering the components using a wave soldering process. Any defect in any of the solder joints will lead to the failure of the circuit. Thus, it is important to ensure that soldering is defect-free. Typical soldering defects are blowholes (insufficient solder) and bridges (solder between two joints). At a Hewlett-Packard India, Ltd., plant in Bangalore, India, a high level of soldering defects was observed, necessitating 100 percent inspection for all circuit boards. Any defects identified required manual rework, which consumed much time.
A study was undertaken to optimize the wave soldering process for reducing defects, thereby eliminating the inspection stage after the process. The quality engineers conducted a detailed study on the solder defects to understand what aspects of the wave soldering process might affect the resulting quality. These were identified as
1. Conveyor speed
2. Conveyor angle
3. Solder bath temperature
4. Solder wave height
5. Vibration of wave
6. Preheater temperature
7. Air knife
8. Acid number (solid content in the flux), which is difficult to control because of environmental conditions
TABLE 6.1 Factors and Levels for Experimentation
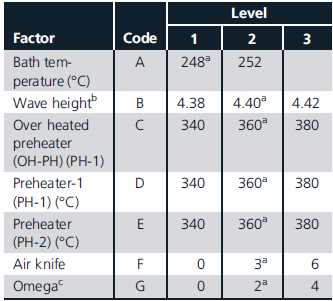
a Existing level.
b The wave height is measured as the rpm of the motor pumping the solder.
c Omega refers to the vibration of the solder wave.
The engineers decided to use experimental design because of the long time frame required to adjust process parameters by trial and error, and the lack of insight into the possible joint effects of different parameters. Based on discussions with technical personnel, seven factors at three levels were selected for the
TABLE 6.2 Data Corresponding to the First Experiment
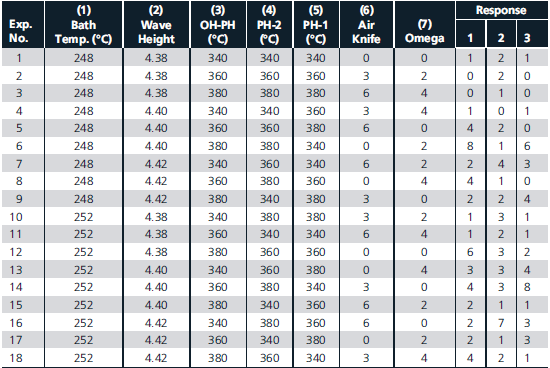
Source: Based on "From Quality Improvement Through Design of Experiments: A Case Study by Kalyan Kumar Chowdhury, E.V. Gigo, and R. Raghavan".
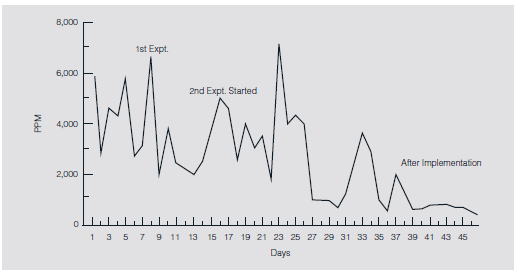
FIGURE 6.29 Solder Defects After Experimental Design Optimization
experiment, as shown in Table 6.1. Conveyor speed and conveyor angle were fixed. A full factorial experiment would take 1,458 trials to conduct, which was not deemed to be practical. From statistical theory in the design of experiments, the seven main effects could be estimated by conducting only 18 trials as shown in Table 6.2. The experimental outcomes (response) were the number of defective solder joints in a frame (352 joints). Each experiment was repeated three times.
Using analysis of variance, it was observed that bath temperature, wave height, and omega had a significant effect on the soldering defects. By setting the factors at the optimum levels identified through the experiments, the predicted defect level was 1,670 ppm as opposed to the current rate of more than 6,000 ppm. However, the predicted average and the result of a confirmatory experiment were not sufficient to eliminate inspection completely, so additional experimental designs were conducted to reduce defects.
The next experiment considered the results of the first experiment and some of the uncontrollable factors. However, the different levels of the significant factors from the first experiment were selected in such a way that the new levels were allowed to vary around the optimum level of the first experiment. Based on the results of these additional experiments, new optimum levels of factors were identified and implemented with significant improvements. Figure 6.29 shows the parts per million level during the course of the experimentation, which took only 45 days.
What were some of the advantages of using experimental design over a traditional trial-and-error approach?
A study was undertaken to optimize the wave soldering process for reducing defects, thereby eliminating the inspection stage after the process. The quality engineers conducted a detailed study on the solder defects to understand what aspects of the wave soldering process might affect the resulting quality. These were identified as
1. Conveyor speed
2. Conveyor angle
3. Solder bath temperature
4. Solder wave height
5. Vibration of wave
6. Preheater temperature
7. Air knife
8. Acid number (solid content in the flux), which is difficult to control because of environmental conditions
TABLE 6.1 Factors and Levels for Experimentation
a Existing level.
b The wave height is measured as the rpm of the motor pumping the solder.
c Omega refers to the vibration of the solder wave.
The engineers decided to use experimental design because of the long time frame required to adjust process parameters by trial and error, and the lack of insight into the possible joint effects of different parameters. Based on discussions with technical personnel, seven factors at three levels were selected for the
TABLE 6.2 Data Corresponding to the First Experiment
Source: Based on "From Quality Improvement Through Design of Experiments: A Case Study by Kalyan Kumar Chowdhury, E.V. Gigo, and R. Raghavan".
FIGURE 6.29 Solder Defects After Experimental Design Optimization
experiment, as shown in Table 6.1. Conveyor speed and conveyor angle were fixed. A full factorial experiment would take 1,458 trials to conduct, which was not deemed to be practical. From statistical theory in the design of experiments, the seven main effects could be estimated by conducting only 18 trials as shown in Table 6.2. The experimental outcomes (response) were the number of defective solder joints in a frame (352 joints). Each experiment was repeated three times.
Using analysis of variance, it was observed that bath temperature, wave height, and omega had a significant effect on the soldering defects. By setting the factors at the optimum levels identified through the experiments, the predicted defect level was 1,670 ppm as opposed to the current rate of more than 6,000 ppm. However, the predicted average and the result of a confirmatory experiment were not sufficient to eliminate inspection completely, so additional experimental designs were conducted to reduce defects.
The next experiment considered the results of the first experiment and some of the uncontrollable factors. However, the different levels of the significant factors from the first experiment were selected in such a way that the new levels were allowed to vary around the optimum level of the first experiment. Based on the results of these additional experiments, new optimum levels of factors were identified and implemented with significant improvements. Figure 6.29 shows the parts per million level during the course of the experimentation, which took only 45 days.
What were some of the advantages of using experimental design over a traditional trial-and-error approach?
Explanation Verified
In HP, a company in country I, an experi...
Managing for Quality and Performance Excellence 10th Edition by James Evans ,William Lindsay
Why don’t you like this exercise?
Other Minimum 8 character and maximum 255 character
Character 255


