Managing for Quality and Performance Excellence 10th Edition by James Evans ,William Lindsay
Edition 10ISBN: 978-1305662544Managing for Quality and Performance Excellence 10th Edition by James Evans ,William Lindsay
Edition 10ISBN: 978-1305662544 Exercise 50
Note: Data for many of the problems in this chapter can be found in the Excel workbook C08Data.xlsx on the Student Companion Site. Click on the appropriate worksheet tab as noted in the problem (e.g., Prob. 8-6, etc.) to access the data.
For each of the control charts in Figure 8.56, assume that the process has been operating in statistical control for some time. What conclusions should the operators reach at this point?
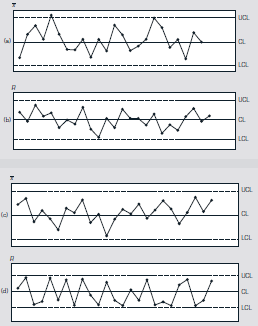
For each of the control charts in Figure 8.56, assume that the process has been operating in statistical control for some time. What conclusions should the operators reach at this point?
Explanation Verified
Different structure of a control chart i...
Managing for Quality and Performance Excellence 10th Edition by James Evans ,William Lindsay
Why don’t you like this exercise?
Other Minimum 8 character and maximum 255 character
Character 255


