Environmental Science 12th Edition by William Cunningham,Mary Ann Cunningham
Edition 12ISBN: 978-0077431204Environmental Science 12th Edition by William Cunningham,Mary Ann Cunningham
Edition 12ISBN: 978-0077431204 Exercise 17
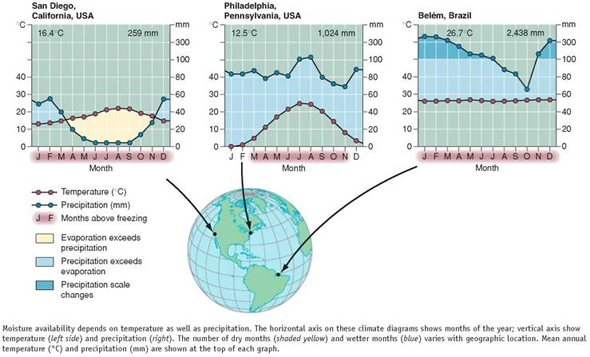
As you've learned in this chapter, temperature and precipitation are critical factors in determining the distribution of terrestrial biomes. Understanding climate graphs and what they tell us is extremely helpful in making sense of these differences. In the figure below, reproduced from figure 5.5 , the graphs show annual patterns in temperature and precipitation (rainfall and snow). They also indicate how much of the year evaporation exceeds precipitation (yellow areas), and when precipitation exceeds evaporation, leaving moisture available for plant growth. Examine these graphs to answer the following questions.
What are the maximum and minimum temperatures in each of the three locations shown
What are the maximum and minimum temperatures in each of the three locations shown
Explanation Verified
Climate gives an idea about the weather ...
Environmental Science 12th Edition by William Cunningham,Mary Ann Cunningham
Why don’t you like this exercise?
Other Minimum 8 character and maximum 255 character
Character 255


